A sleep quality meter that uses heartrate, breathing rate, and movement metrics to judge the quality of the user's sleep.
The What and the Why
We created a system that monitors the quality of the sleep of its user. As busy engineers, we must make the most out of all the sleep that we can get. By creating various metrics to measure the quality of sleep, our project could be used to determine the factors that lead to an optimal sleep at an individual level. Maybe the key to a restful sleep for a given person is going to bed before a certain time, avoiding certain foods, at a certain temperature, etc. This project aims to provide a concrete metric for the quality of sleep.
Overview
The project consists of two main pieces: a base station and a glove. The glove contains a heartbeat sensor, a gyroscope and an accelerometer to measure movement, a conductive stretchy cord to measure breathing rate, and a wireless transciever to relay all of this information to the base station. The base station receives this data from the glove, analyzes it, and saves it so that the user can look back on the quality of their sleep.
High Level Design
Project Rationale
The idea for this project came from Julia's biomedical interests and our mutual desire to maximize what little sleep the ECE major allows us. Sleep is a mysterious thing, something that we can't relfect on or really improve on without outside aid. Solving sleeping problems is a pretty large industry, from various sleep monitoring apps, to sleeping pills, all aimed at helping their user sleep better. Many of these apps work by placing a phone under your pillow before sleeping, and it uses either the phone's microphone or the phone's accelerometer to try and detect movement throughout the night. We thought that combining this idea with a little extra hardware might give us the ability to get access to more metrics during sleep, which might give us better insights into what makes good and bad sleep for us personally.
The metrics we chose to focus on are: heart rate, breathing rate, and movement. We believe that these three metrics are a good representation of a person's restfulness during sleep. Through some preliminary research, we discovered that the differences between sleep states are mostly discerned through changes in bodily functions.
When we are awake out heartrate, breathing, and brain wave activity is very irregular.
When we fall asleep there are two main sleep patterns: REM and non-REM sleep.
In non-REM sleep, our heart rate and breathing decreases and becomes quite regular. However, when we are in REM sleep our vitals are almost just as irregular as when we are awake except for movement. During REM we are temporarily paralized, so we shouldn't see any major movement.
We choose to ignore brain wave activity, which is another indicator of sleeping state. Because that would be very costly to measure accurately.
Logical Structure
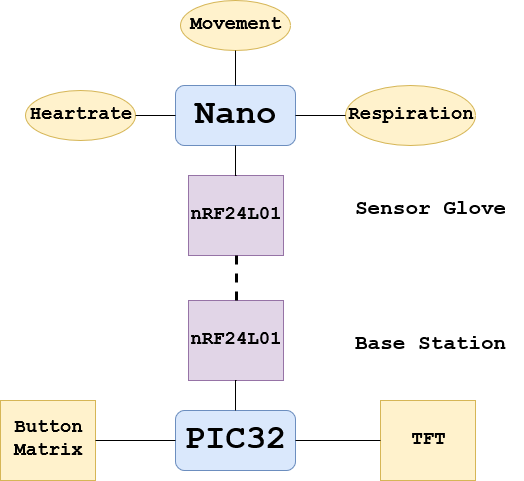
The project consists of two main pieces: the glove and the base station. The glove is meant to be worn by the user as they sleep, and the basestation receives data in realtime and computes various sleep metrics. The glove records movement via an accelerometer, heartrate via a custom sensing circuit, and breathing rate via a stretchable conductive cord. Below is a block diagram that attempts to represent the various pieces of the project:
Hardware/Software Tradeoffs
Throughout this design there were a few tradeoffs that we were faced with. We had to keep the hardware on the glove quite small, which limited the types of sensors that we could use, as well as forcing us to use the smallest components possible. We also had to make sure each of the componenets on the glove itself were relatively low power, so that it would last throughout a typical 8 hour night's sleep.
Program/Hardware Design
Program Details
SPI Slave Mode and Communication
In order to communicate with the Arduino Nano, we decided it would be best to connect the two over SPI (see hardware section for more details). Since the Arduino is frequently communicating with its wireless transciever and the PIC32 is only seldom communicating with the SD card (in large bursts), we kept the arduino as the SPI master and the PIC alternates between slave and master modes. A pin from the PIC tells the Arduino when it is using the bus and when it should stop writing (during SD card transfers).
We use the following code to shift the PIC32 into slave mode:
In order to receive bytes from the Arduino, we manually poll the CS line (we had some trouble getting framed SPI w/ interrupts to behave correctly) and then manually pull 2 16 bit values off of the bus with the following code:
// Poll the CS pin
if (mPORTAReadBits(BIT_3)) {
continue;
}
// CS is low... QUICK read!
int j;
for (j = 0; j < 2; j++){
spi_buffer[j] = SpiChnGetC(2);
}
// Do stuff with the received data
SPI_rec(spi_buffer[0], spi_buffer[1]);
Since we are using SPI to transfer values between the arduino and the PIC, the transfered data consists only of updated glove data. Therefore, we implemented an extremely simply SPI protocol: each transaction is 32 bits, with the first 16 bits corresponding to an unique identifier, which maps to a specific variable to update. The next 16-bits contain the update value of that variable. This allows us to transfer realtime data from the glove to the basestation.
Button Inputs
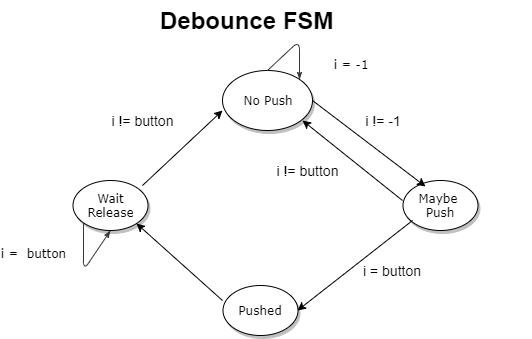
In order to handle user inputs, we implemented a system very similar to lab 2. A debouncing FSM tracks the state of each of our 3 buttons over time and determines when a valid button press has occured. It then triggers an update that could update a menu, move to a new menu, start recording data, etc. Below is a representation of the FSM we implemented to handle debouncing.
Drawing Graphs
In order to allow the user to easily see a representation of the various recorded metrics over the course of their sleep, we have implementing a function that will graph an arbitrary long sequence of data points with an arbitrary y-range on the TFT display. The goal of this function was to be simple to use while being relatively simple to implement. To this end, this method signature is extremely simple, simple specify a data array and the color you'd like it to be plotted in, and the plot is generated. The method signature is as follows:
void draw_graph( int * data, int size, unsigned short color )
We split the function up into a few steps. First, find the maximum and minimum values to contruct a range of the data. These points will serve as the top and bottom of the graph for maximum data visibility. To make the implementation easier, we truncate the data to be a multiple of 50 (generally the amount of points we want to graph is much higher than 50 so we lose very little data) and then average the data into dicrete chunks that get plotted:
// Figure out what multiple of 50 we are
int mult_50 = size/50;
size = mult_50 * 50; // Truncate to multiple of 50
// Now condense the data array into a new array
// Sampled accoring to the block size
int new_data_index = 0;
for (i = 0; i < size; i += mult_50){
int j, average = 0;
for (j = i; j < i + mult_50; j++)
average += data[j];
data[new_data_index++] = average / mult_50;
}
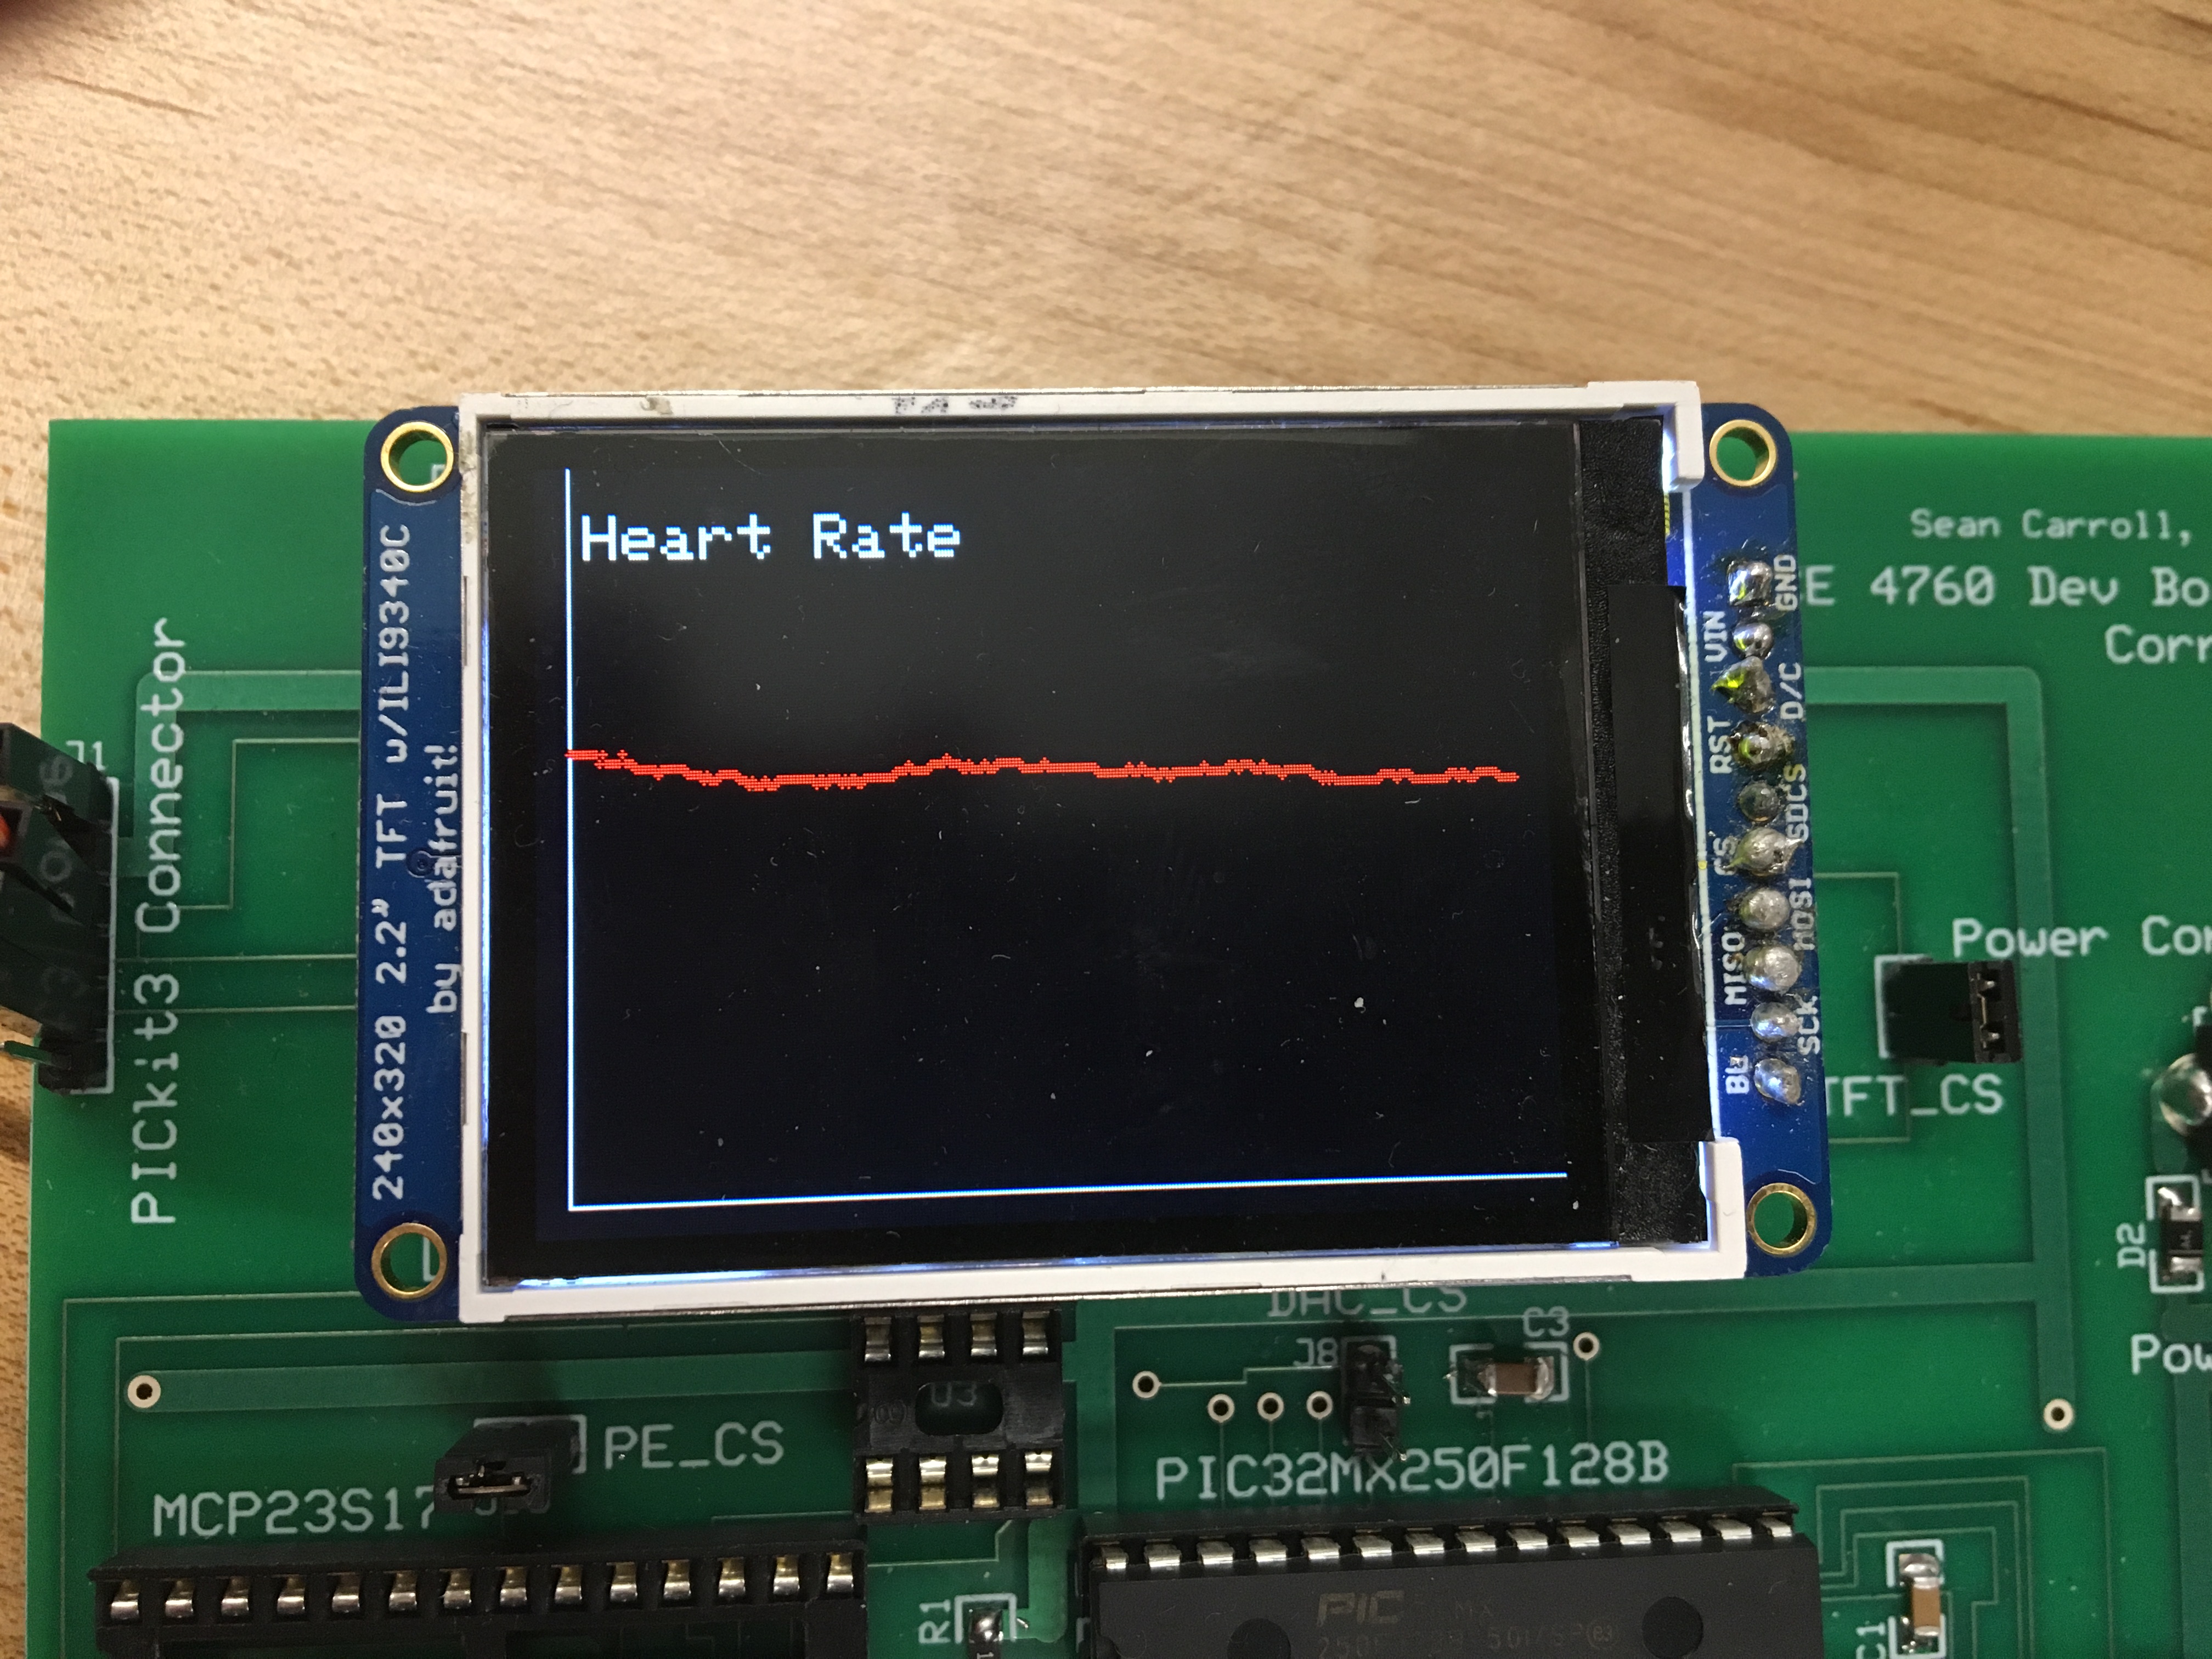
Once we have this, it's very easy to draw the 50 points ouputted by the the above code. Here is a shot of a basic graph:
Sleep Quality Analysis
In order to try and compute a metric for sleep quality, we start by taking various statistics from the data we had available: breathing rate, heart rate, and movement. We measure movement by taking raw accelerometer data and looking at the change in x, y, and z over many samples. We use this to calculate a "chaos" value for each axis, and then add each axis's value together, resulting in a metric for overall movement.
The algorithm looks for a few things to determine sleep quality. As a general rule, it looks for smooth, cyclic transitions in the heartbeat and breathing rate data. For movement, we've observed that there can be a few spikes when rolling over or for other relatively small movements. We also had to add some detection for connection loss or sensor malfunction. Occassionally, the nRF24L01 chips can fail to send data for a few seconds a time, which causes a loss of sensor data. At these times, the data that gets logged is a 0, which is ignored by the algorithm when calculating the various metrics. These sensor errors were causing confusing outputs for us for some time, until we realized that issues like the user's finger temporarily coming off the heartrate sensor and wireless communication cutting out were skewing our results. Adding this check produces much more desireable results.
In order to calculate a sleep quality percentage, we look at the rate of change of each of the three metrics. Good sleep is characterized by smooth cyclic transitions of both heart rate and breathing rate, with relatively low movement during deep sleep. To use the chaoticness of these metrics in our calculation, we first have to find these values. Below is a code sample that pulls statistics from the raw heart rate data:
// Calculate average BPM and derivative of BPM
int bpm_sum = 0;
int bpm_deriv_sum = 0;
for (i = 0; i < indata->bpm_data_size; i++){
bpm_sum += indata->bpm_data[i];
if (i+1 < indata->bpm_data_size)
bpm_deriv_sum += abs(indata->bpm_data[i+1] - indata->bpm_data[i]);
}
outdata.average_bpm = bpm_sum / indata->bpm_data_size;
outdata.average_deriv_bpm = 1000*bpm_deriv_sum / (indata->bpm_data_size - 1);
Once we have this data, we can empirically map it to various ranges to determine the quality of sleep. The final output of this sleep quality analysis is shown in the results section, which shows the overall summary along with graphs of heart rate, breathing rate, and movement.
Hardware Details
The Glove
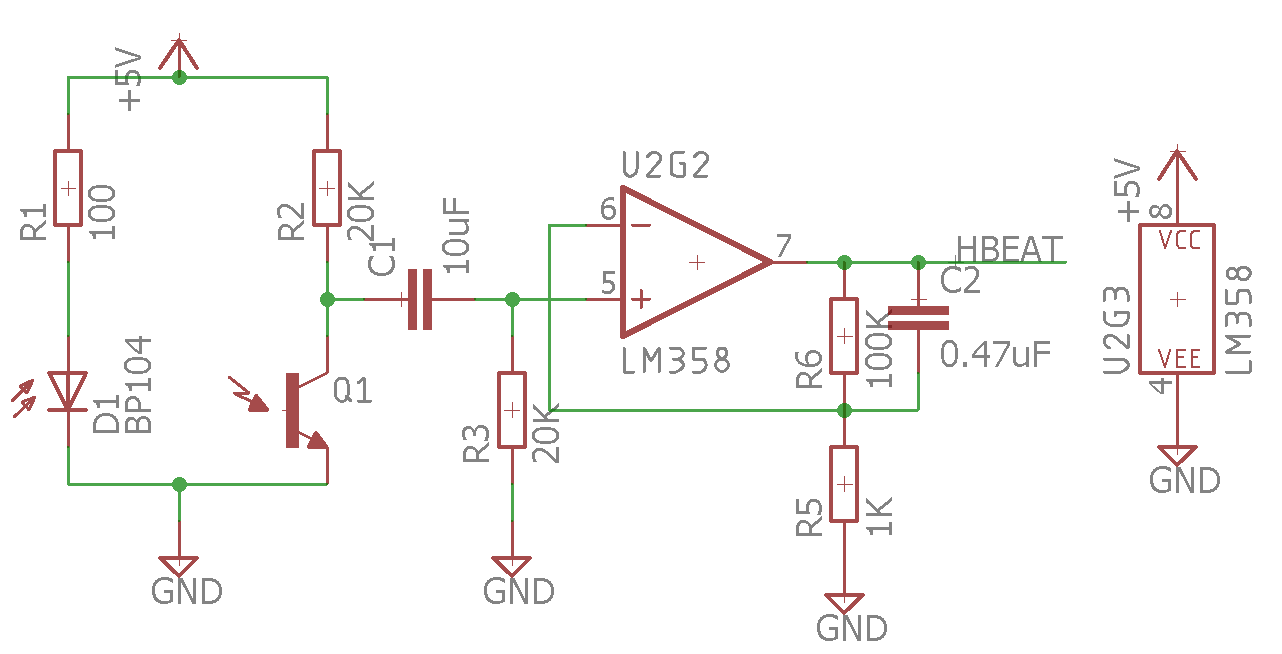
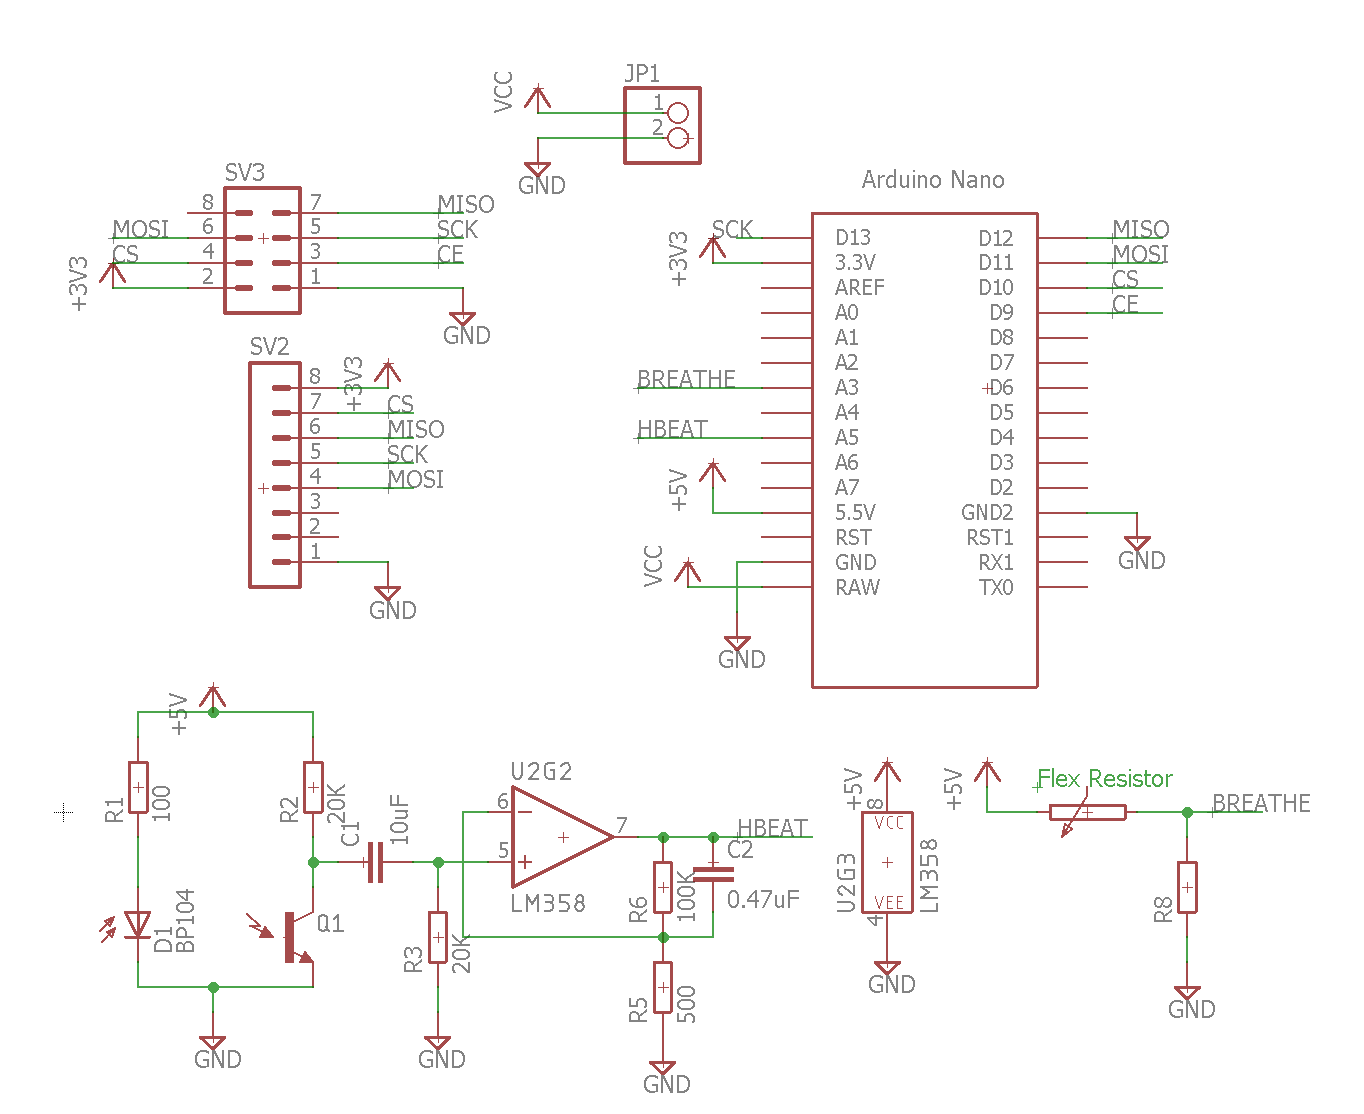
The glove serves as a remote sensor worn by the user, relaying data to the basestation in realtime. It consists of an Arduino Nano, an acclerometer/gyroscope combined IC, an nRF24L01 2.4 GHz transciever, circuitry for a breathing rate sensor, and circuitry for a heartbeat sensor. The schematic for the glove is shown below:
The connections for the various components on the glove are fairly straightforward. The accelerometer and wirelesss transceiver both communicate with the Arduino Nano over SPI, and while the nRF24L01 is powered by a maximum of 3.6V, the data lines are all 5V tolerant, which makes direct wiring between the two possible.
The heartrate sensor consists of an IR transmitter, an IR phototransistor, OP amp, and filter circuitry. The IR LED emits infrared light into the user's finger, of which portions are reflected back out of the finger and hit the phototransistor. The amount reflected changes with blood pressure and blood oxygen level. The output of the phototransistor is filtered through a high pass filter, and then gets amplified 200x by a non inverting amplifier. The output of this amplifier is read by the arduino.
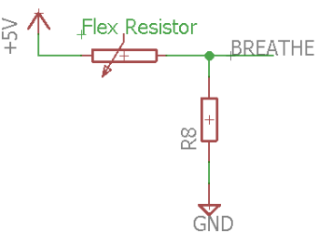
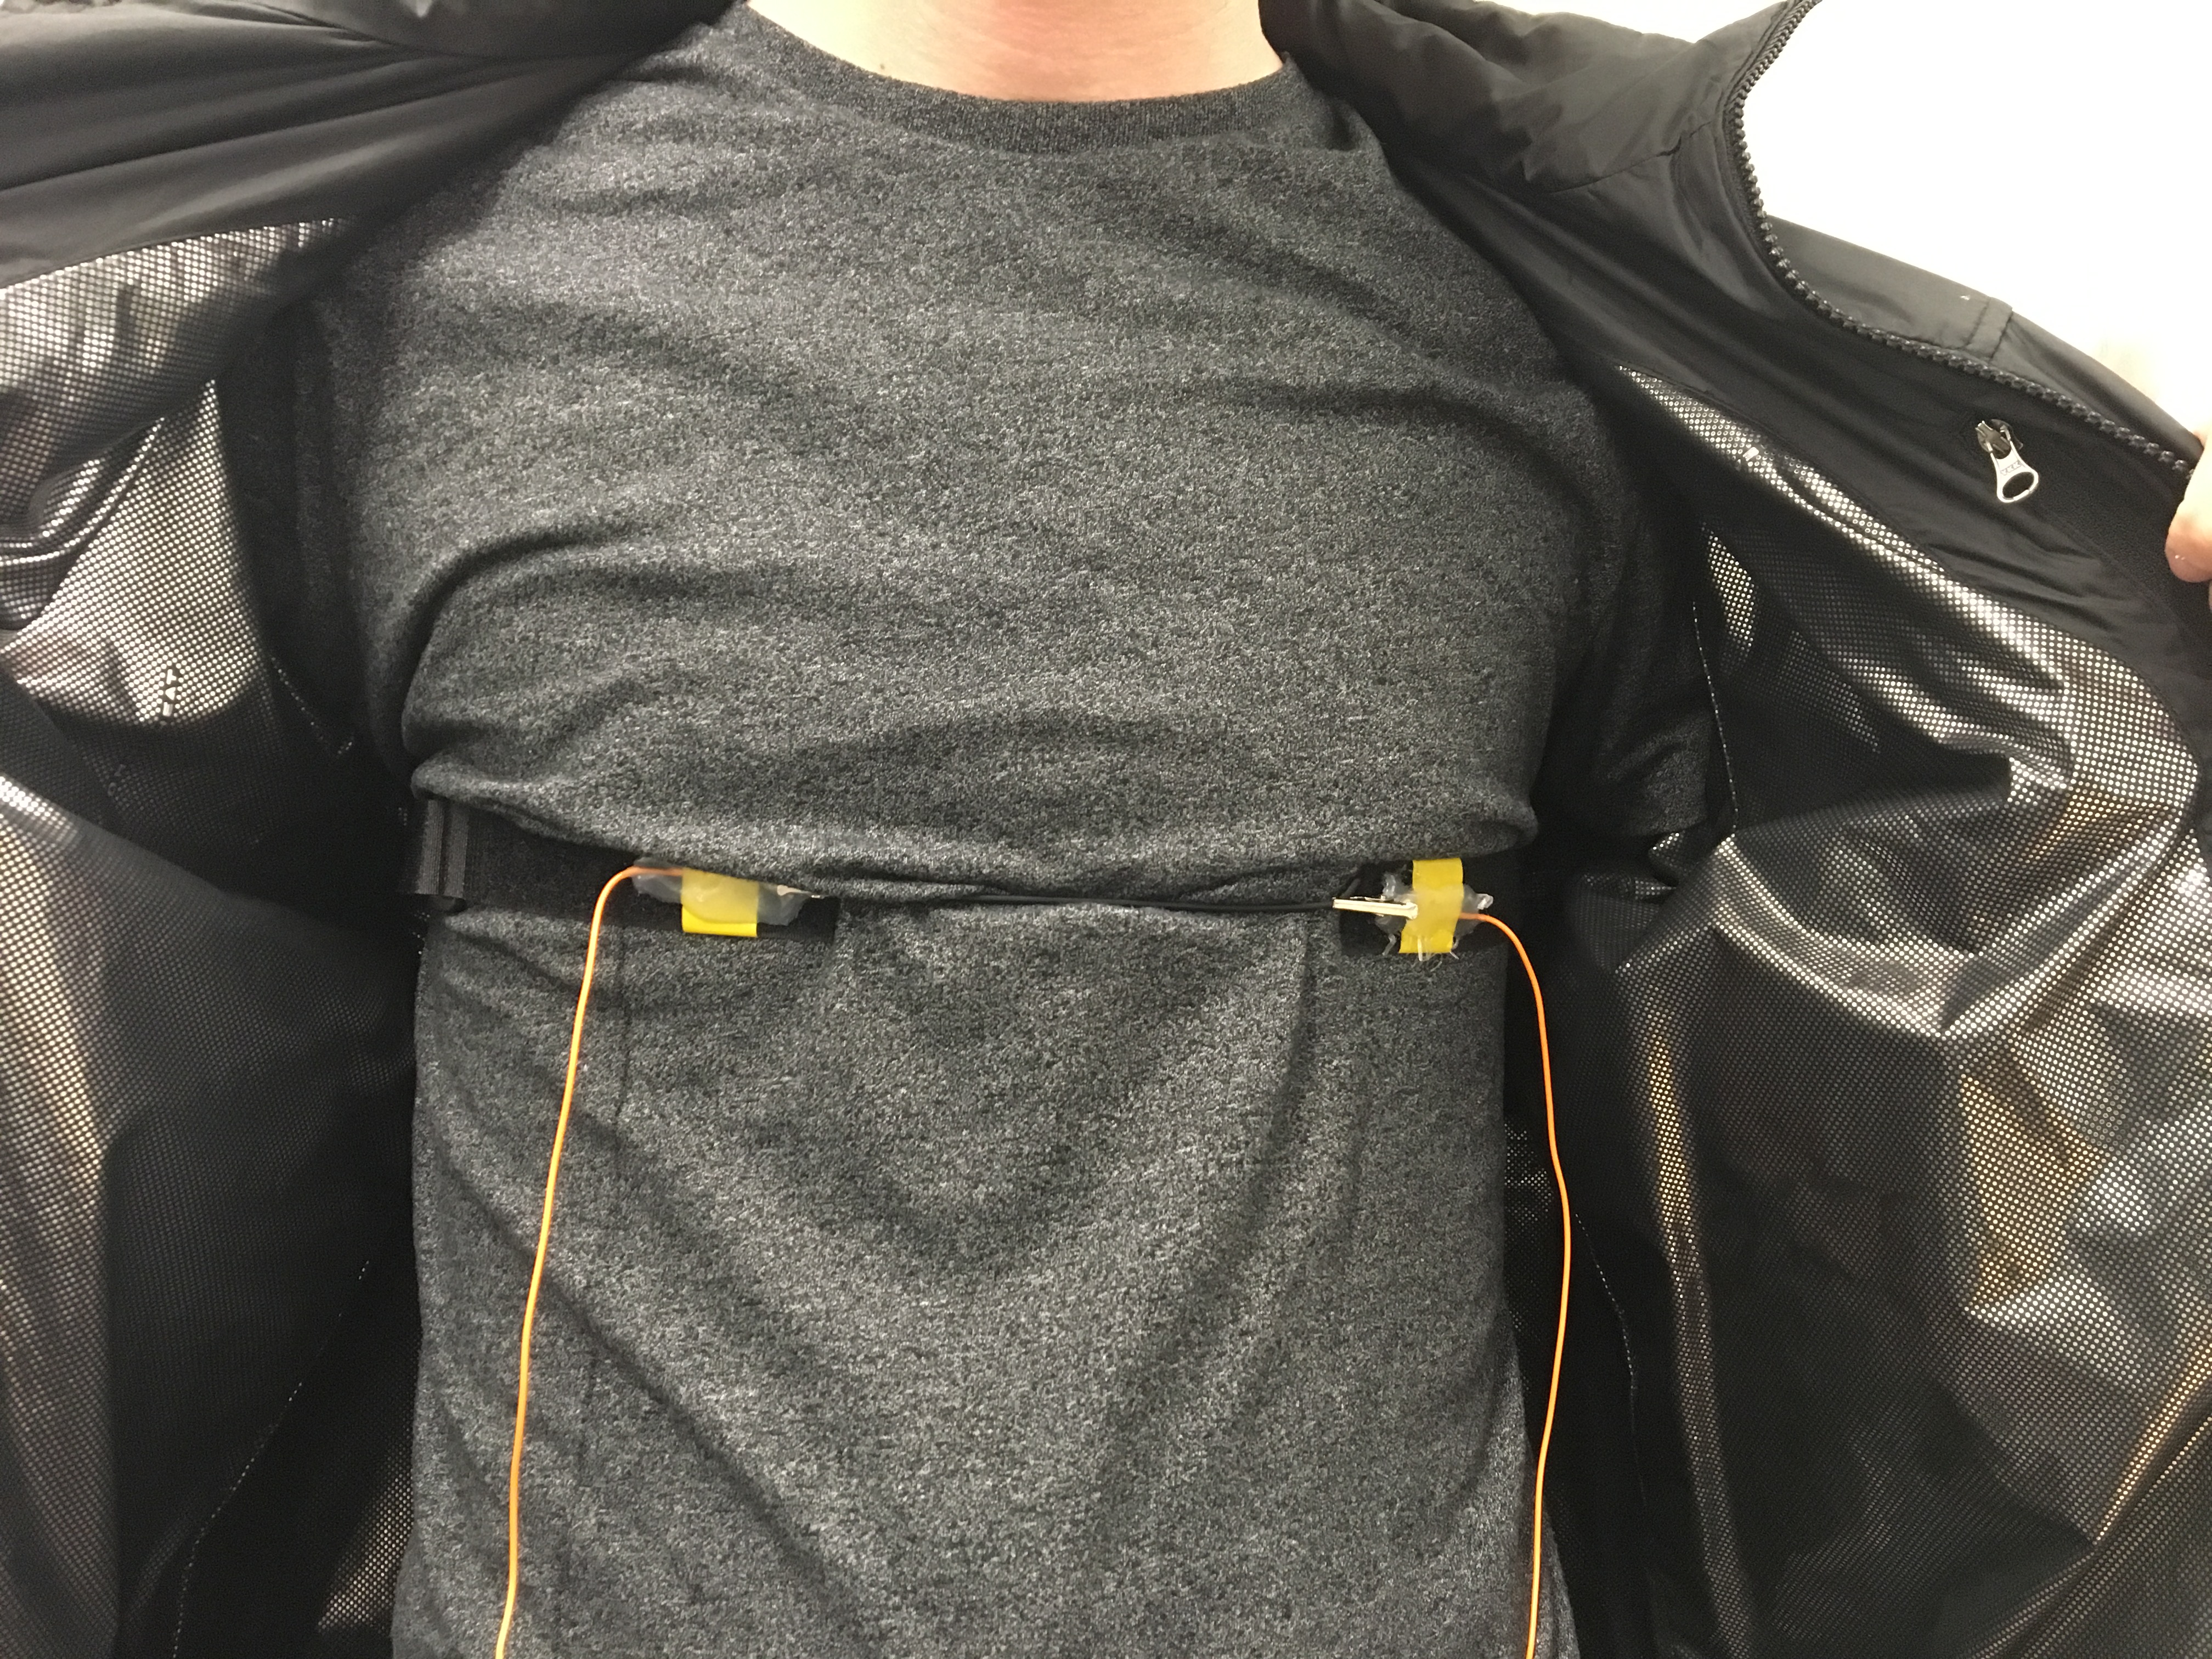
In order to read the breathing rate of the user, we used a conductive stretchable cord that changes its resistance as it expands and contracts. We use this as the top half a voltage divider in order to sense the compression or expansion of the user's chest/abdomen, corresponding to when they are inhaling or exhaling. The output of the voltage divider is read by an ADC connected to the nano, whose readings are relayed to the PIC for analysis.
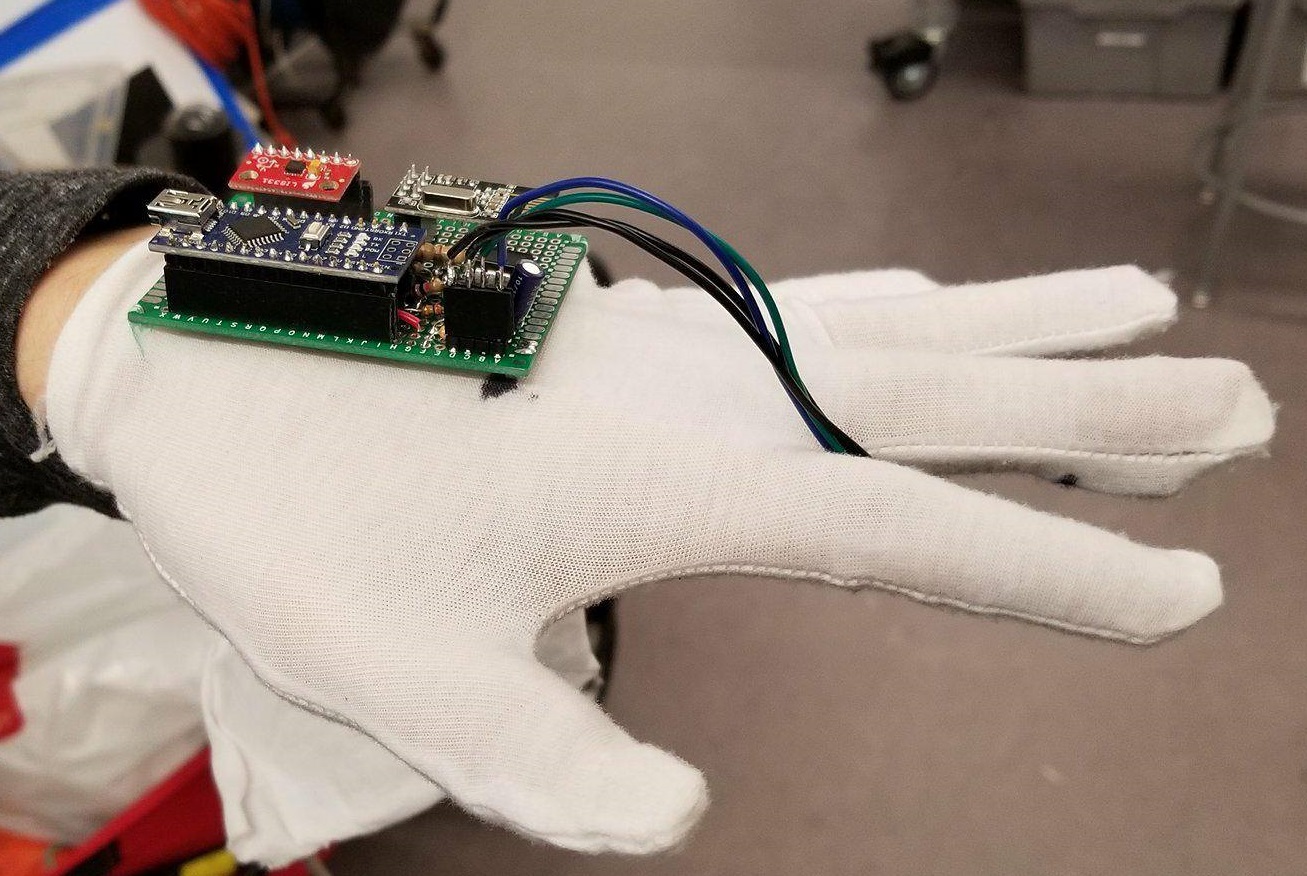
In order to mount the main glove board to the glove, we sewed the mounting holes of the board to the glove with thread. The heartbeat sensor is mounted inside the index finger in the glove, so that it slips on the user's finger when they wear it. Below is a picture of the completed glove!
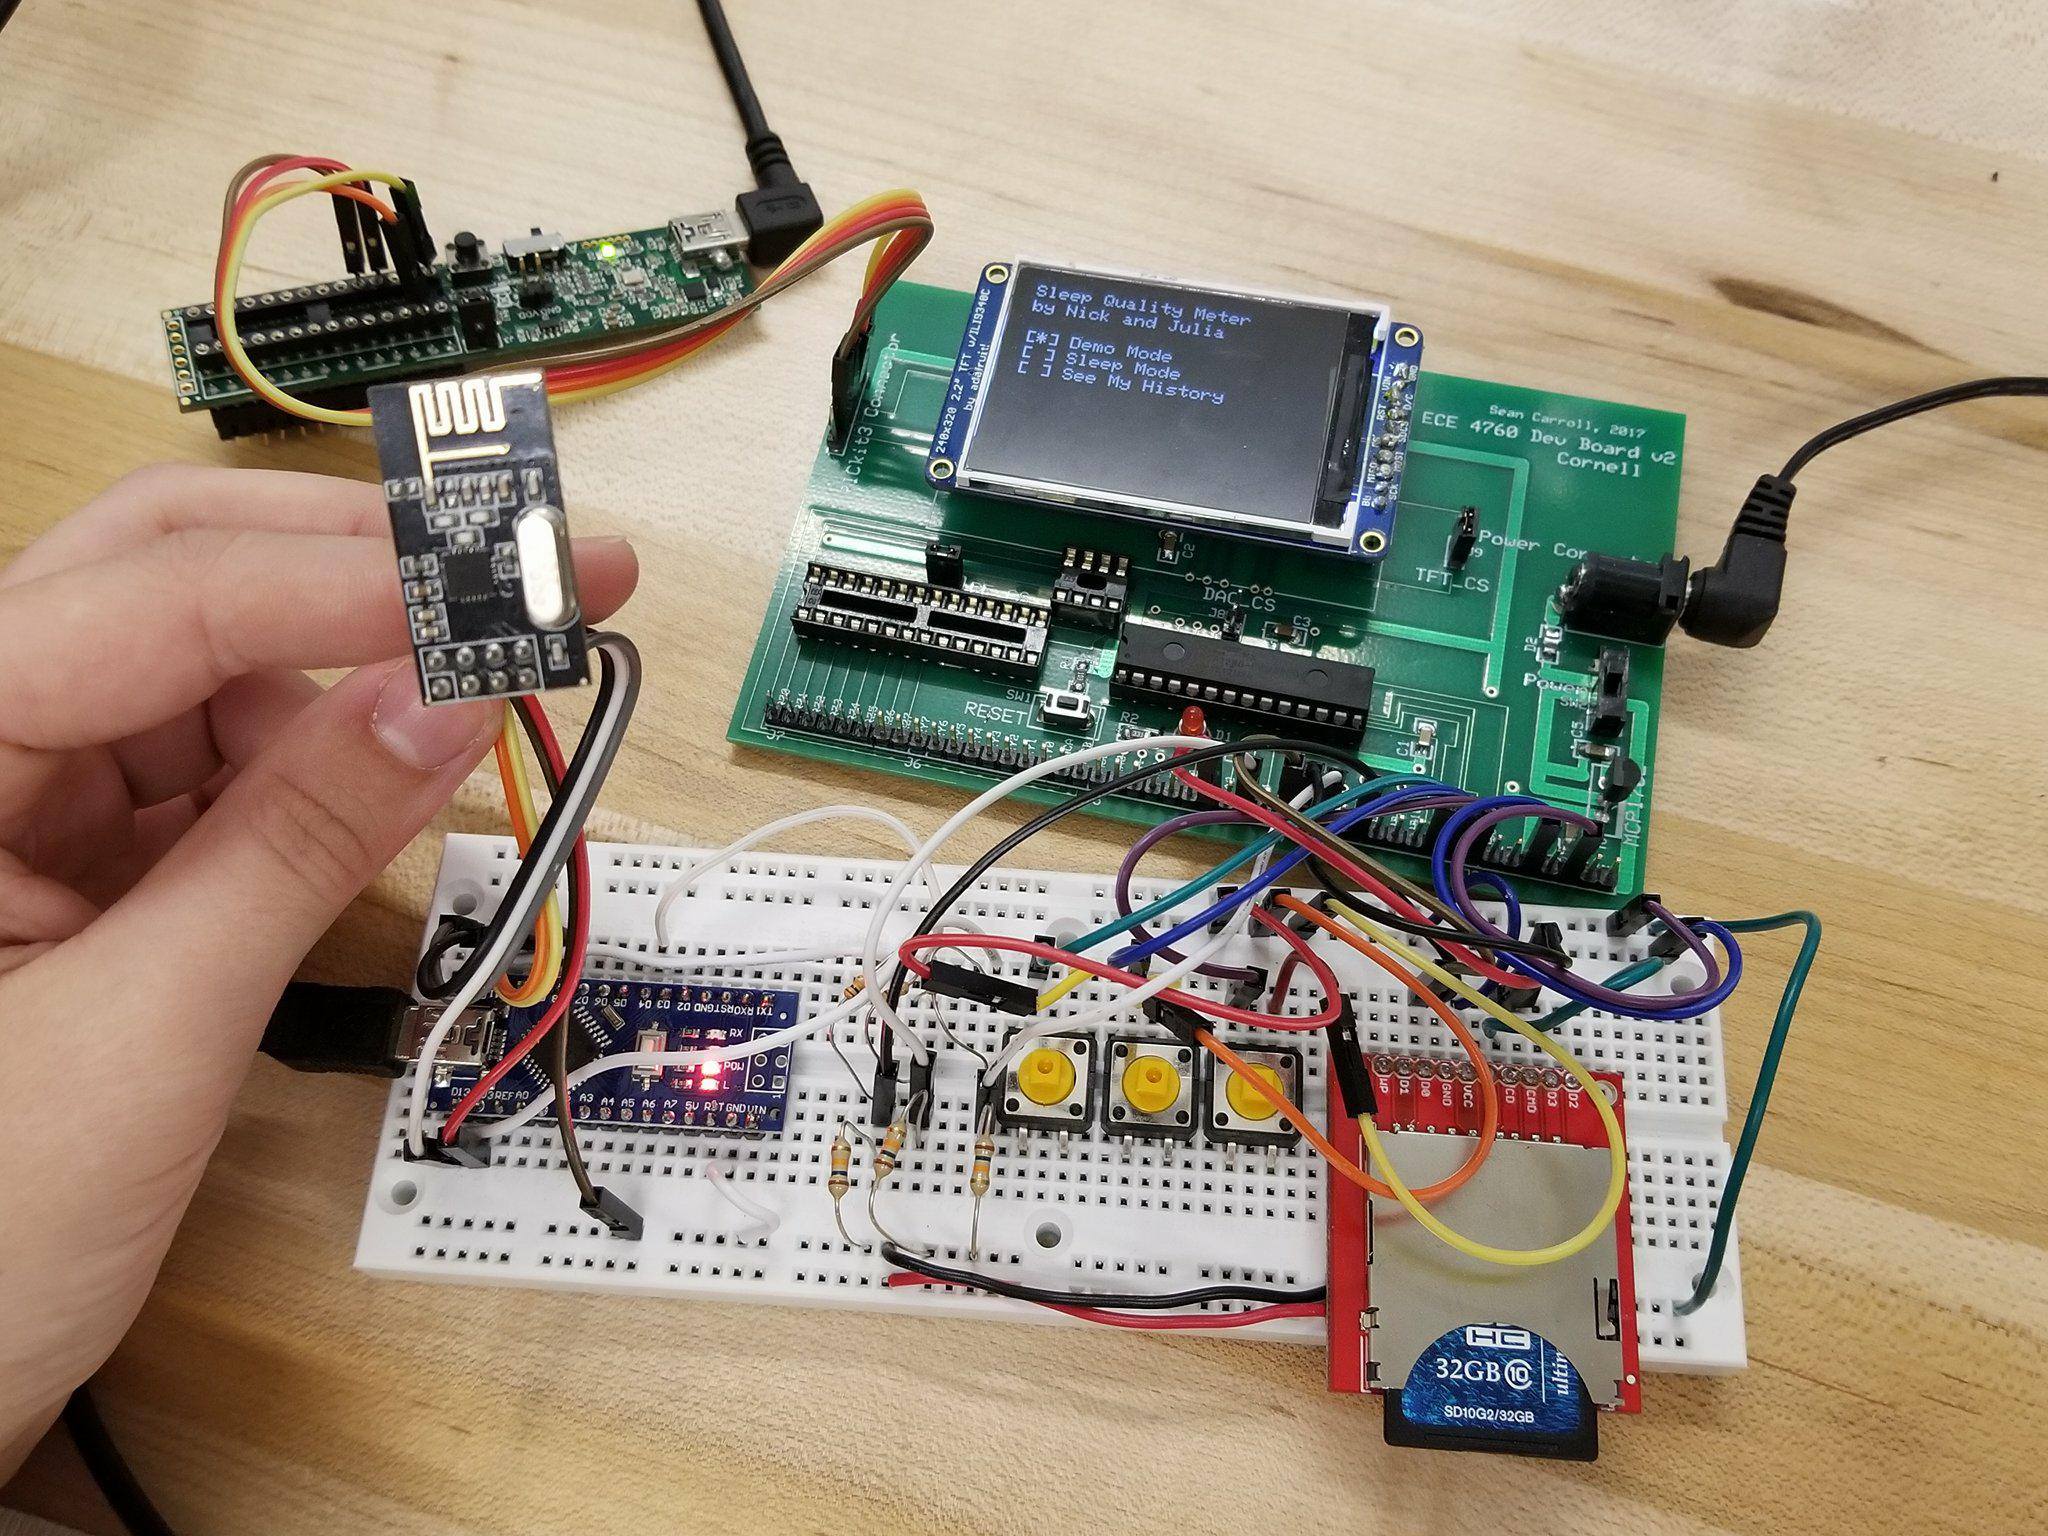
The Base Station
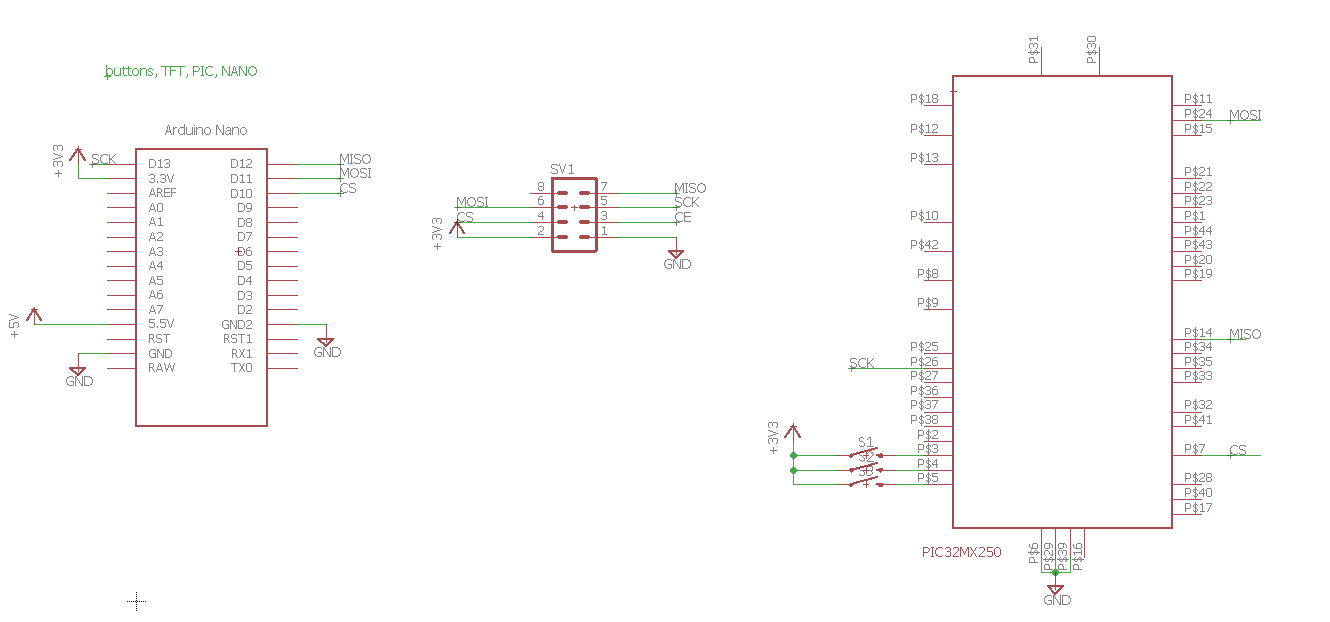
The base station houses the PIC32 microprocessor, TFT display, user interface, and wireless transceiver. It performs all of the calculations and analysis, stores sleep data, and provides an easy to use interface to display the data. The following is the full schematic of the base station.
In order to receive real-time data from the glove, we have another nRF24L01 on the basestation to facilitate wireless communication. The PIC recieves the data over SPI for processing.
The PIC also has three buttons to allow the user to navigate menus, view data, and edit parameters. Generally, the buttons perform the following actions, from left to right: move cursor down, run highlighted command, move cursor up. The buttons are connected directly to the PIC which uses its internal pullup resistors to bring the pin to +3.3V, the other end of the button it pulled to ground, which pulls the corresponding input pin to ground when pushed.
The PIC uses the provided "big board" (development board) designed by Sean Carrol. It provides a socket for the MCU, TFT display, 5V to 3.3V voltage regulator, a full break out of IO pins, broken out PICkit programming header, and sockets for a DAC and port expander (which we do not use for this project). The big board has allowed us to prototype and iterate quickly without worrying about bad connections or incorrectly connection wires.
Bloopers
Throughout this project there were a few things that did not go as planned. We started off with the initial goal of creating a wrist mounted system, with the main limiting component being the heart rate sensing. After trying a few different approaches, experimenting with different wavelengths of light, different intensities and amplifictaions, we were not able to create a reliable heartbeat sensor on the wrist. That's where the glove idea was born, as it is much easier to sense a heartbeat in the fingertip and a glove would give us a good way to mount and secure the sensor.
Another problem that we faced was saving data. We were briefly able to use a sd card library written by a Cornell MEng student to log data onto an sd card in a fat32 format, but it suddenly stopped working entirely. After spending a significant amount of time debugging issue, we salvaged the test runs we managed to save on the SD card and began streaming data into RAM, and doing some realtime analysis every so often to lessen the memory footprint of the incoming data. This worked quite well, and allowed us to do analysis in realtime.
Results
Heart Rate
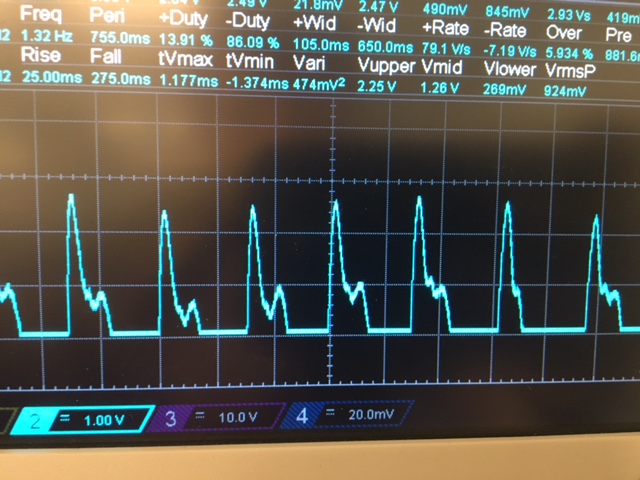
The heartbeat sensor we made performed quite well once we had it permanentaly mounted to a protoboard to keep a constant distance between the IR emitted and receiver. Its reliability increased even further when it was mounted inside the glove, providing a relatively constant pressure between the sensor and the user's finger. As shown in the following oscilloscope snapshot, the sensor picks up the initial rise in blood pressure, the following dip, and then the following rise, corresponding to a single heartbeat:
We were able to achieve about a 3 volt peak voltage from our sensor with minimal noise, even when moving around slightly, which has allowed us to make clean heartbeat readings.
Breathing Rate
In order to try and gain access to another metric to base our sleep metric on, we added a breathing rate sensor, with the main componenet being a conductive strethable cord. The cord's resistance changes as it expands and contracts, and we can use this as part of a resistor divider to measure the change in voltage. Over time, we were able to get a pretty clear view of the rising and falling of a person's chest. The breathing sensor is shown below:
Sample Sleep Quality Results
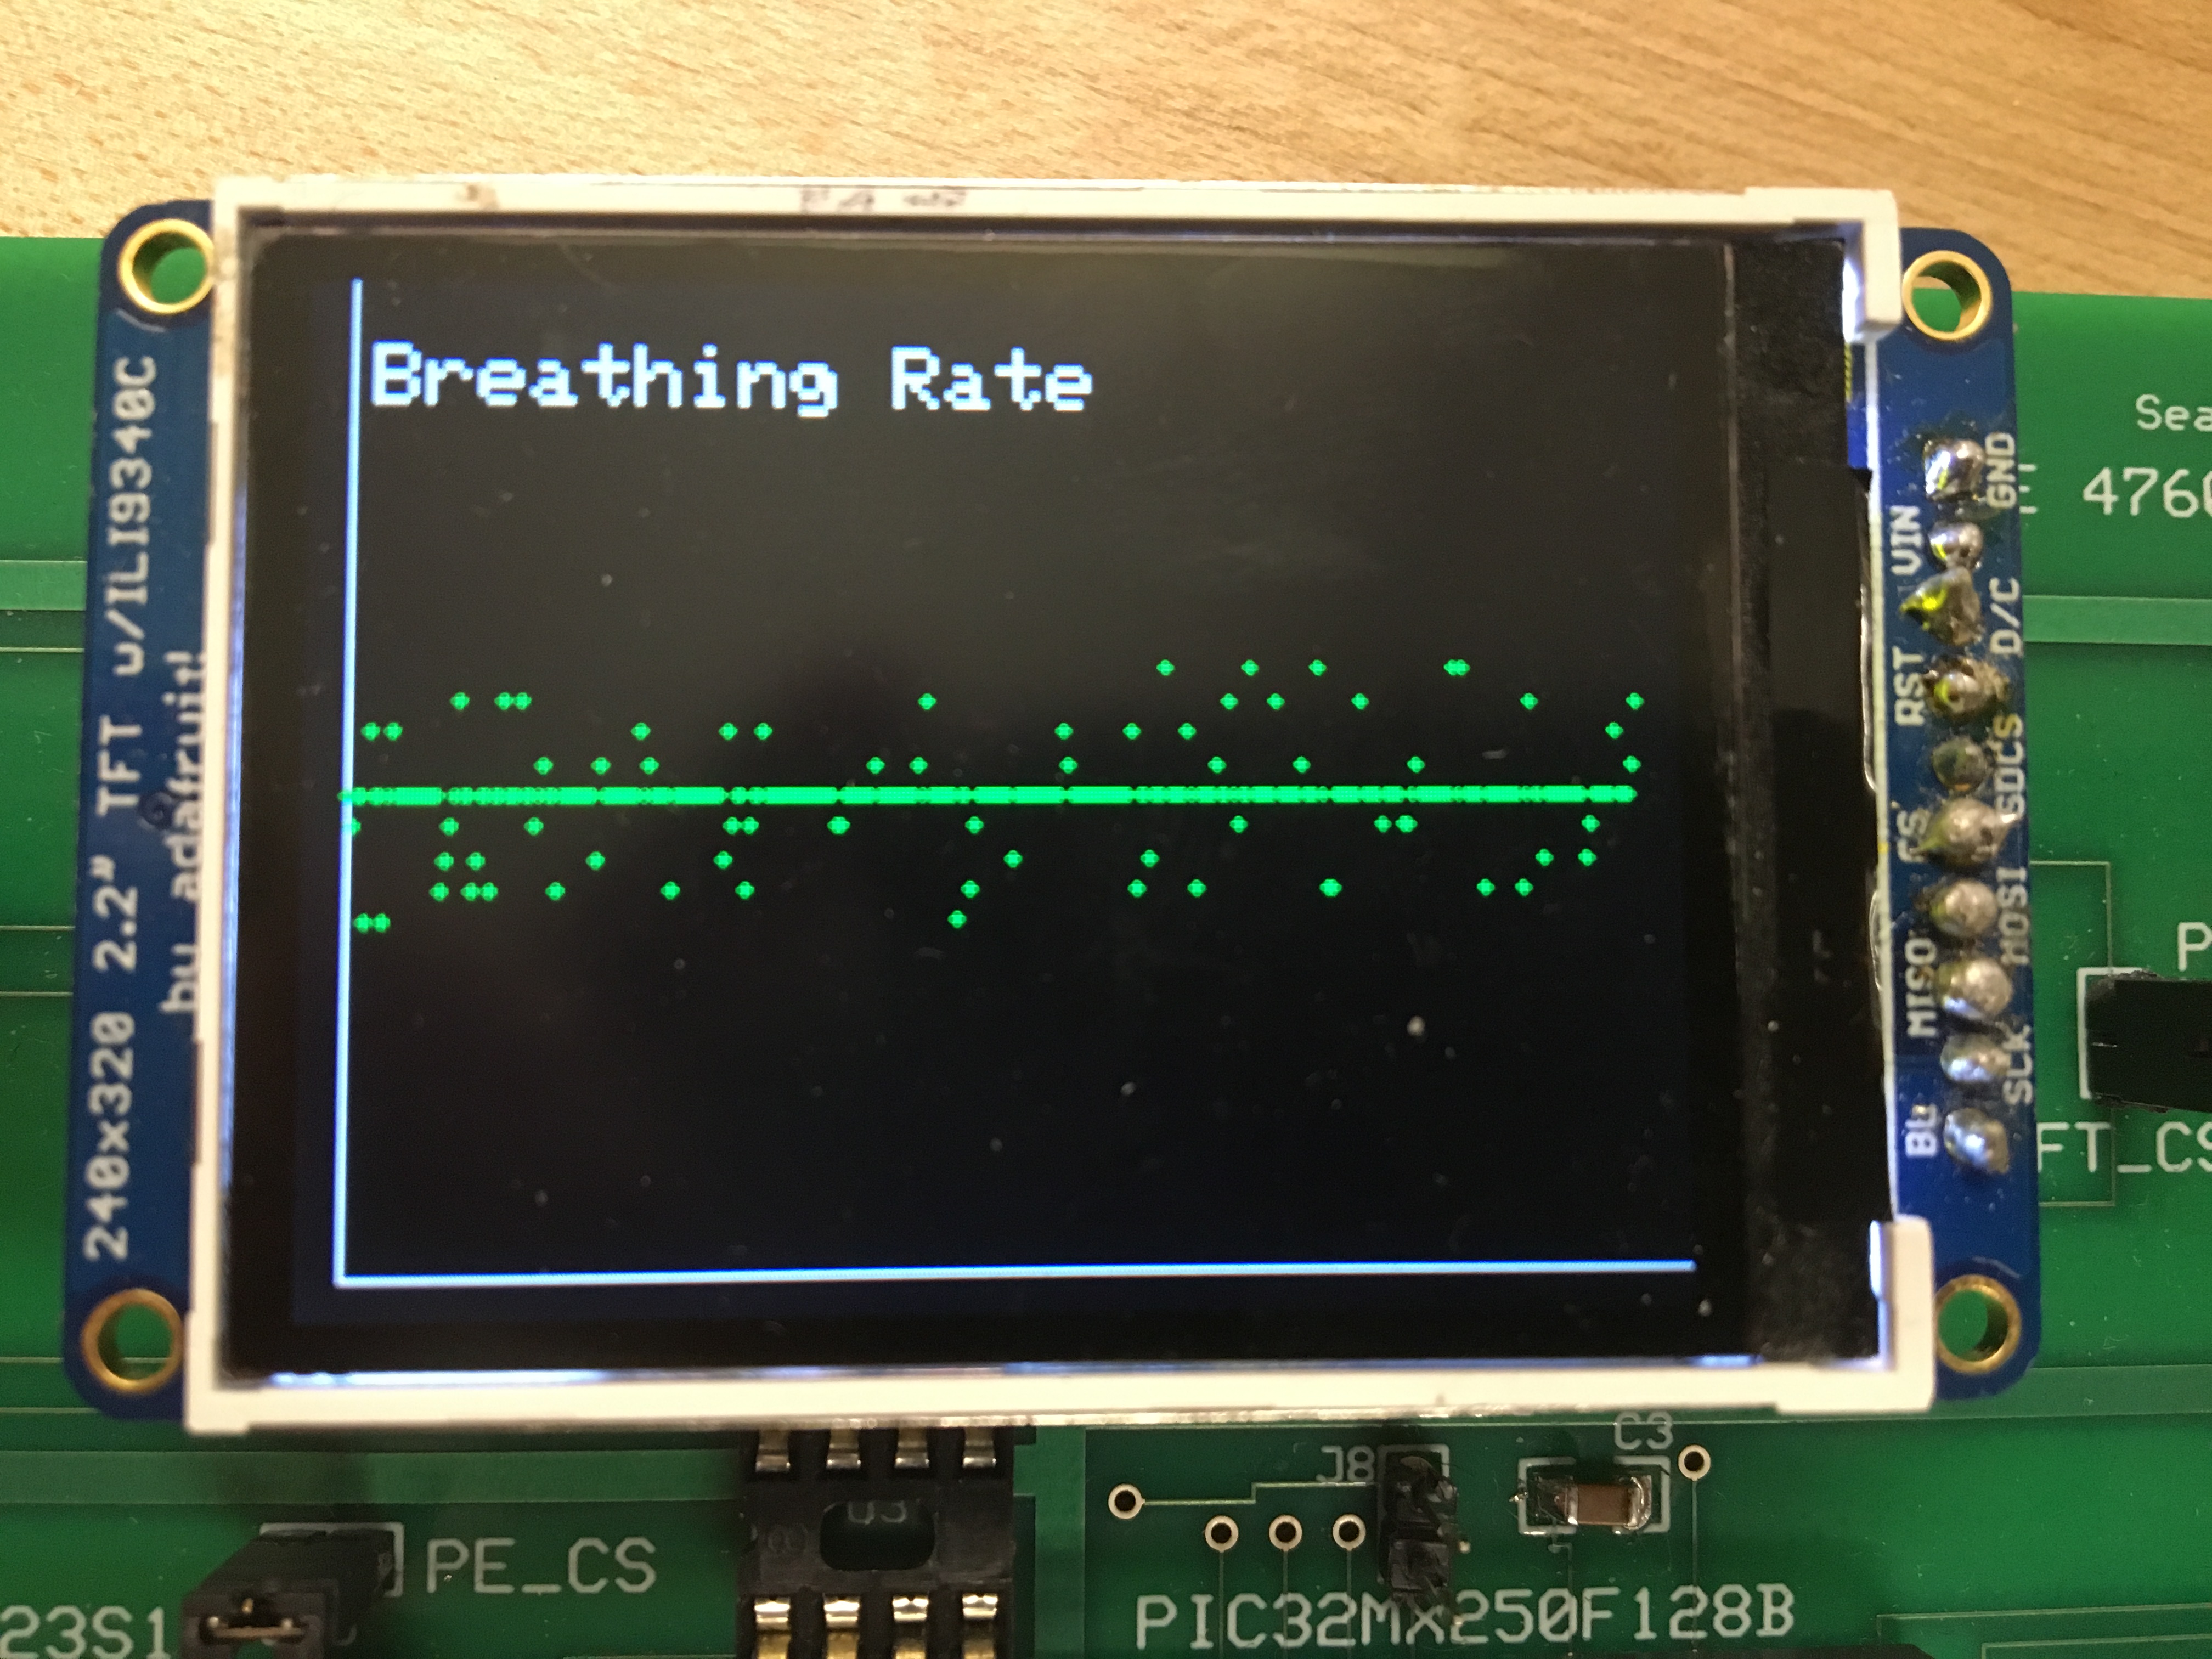
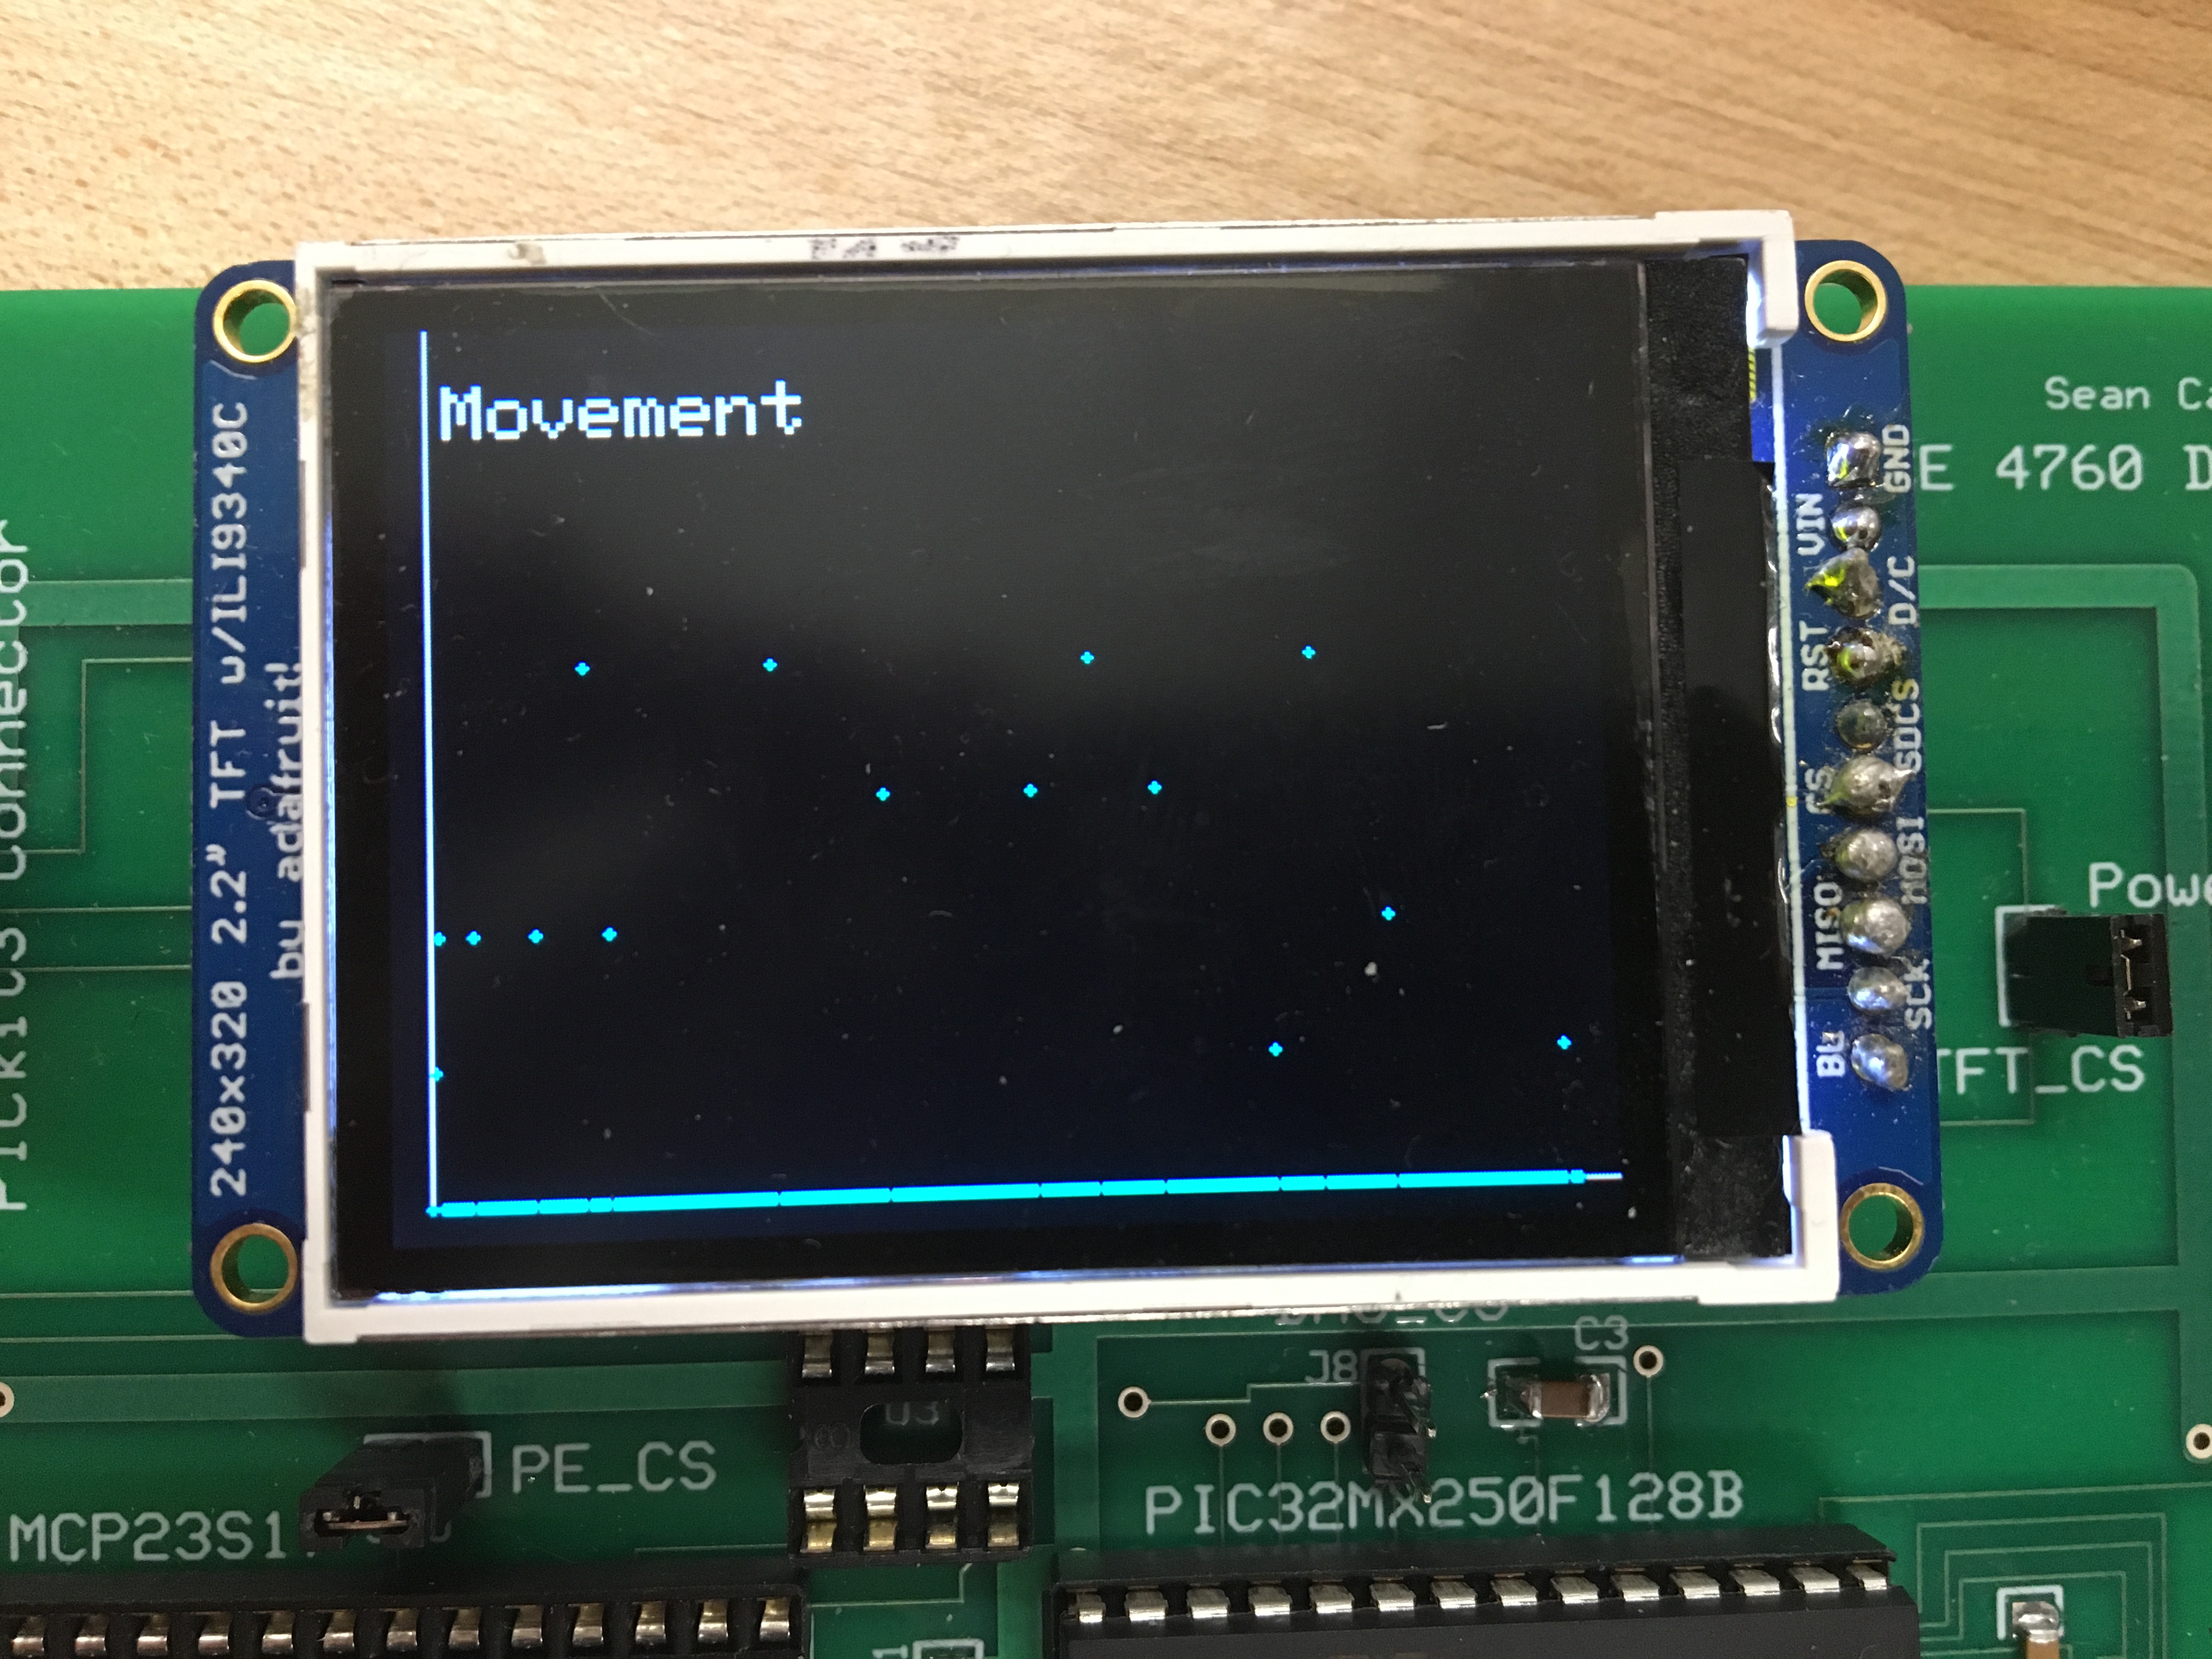
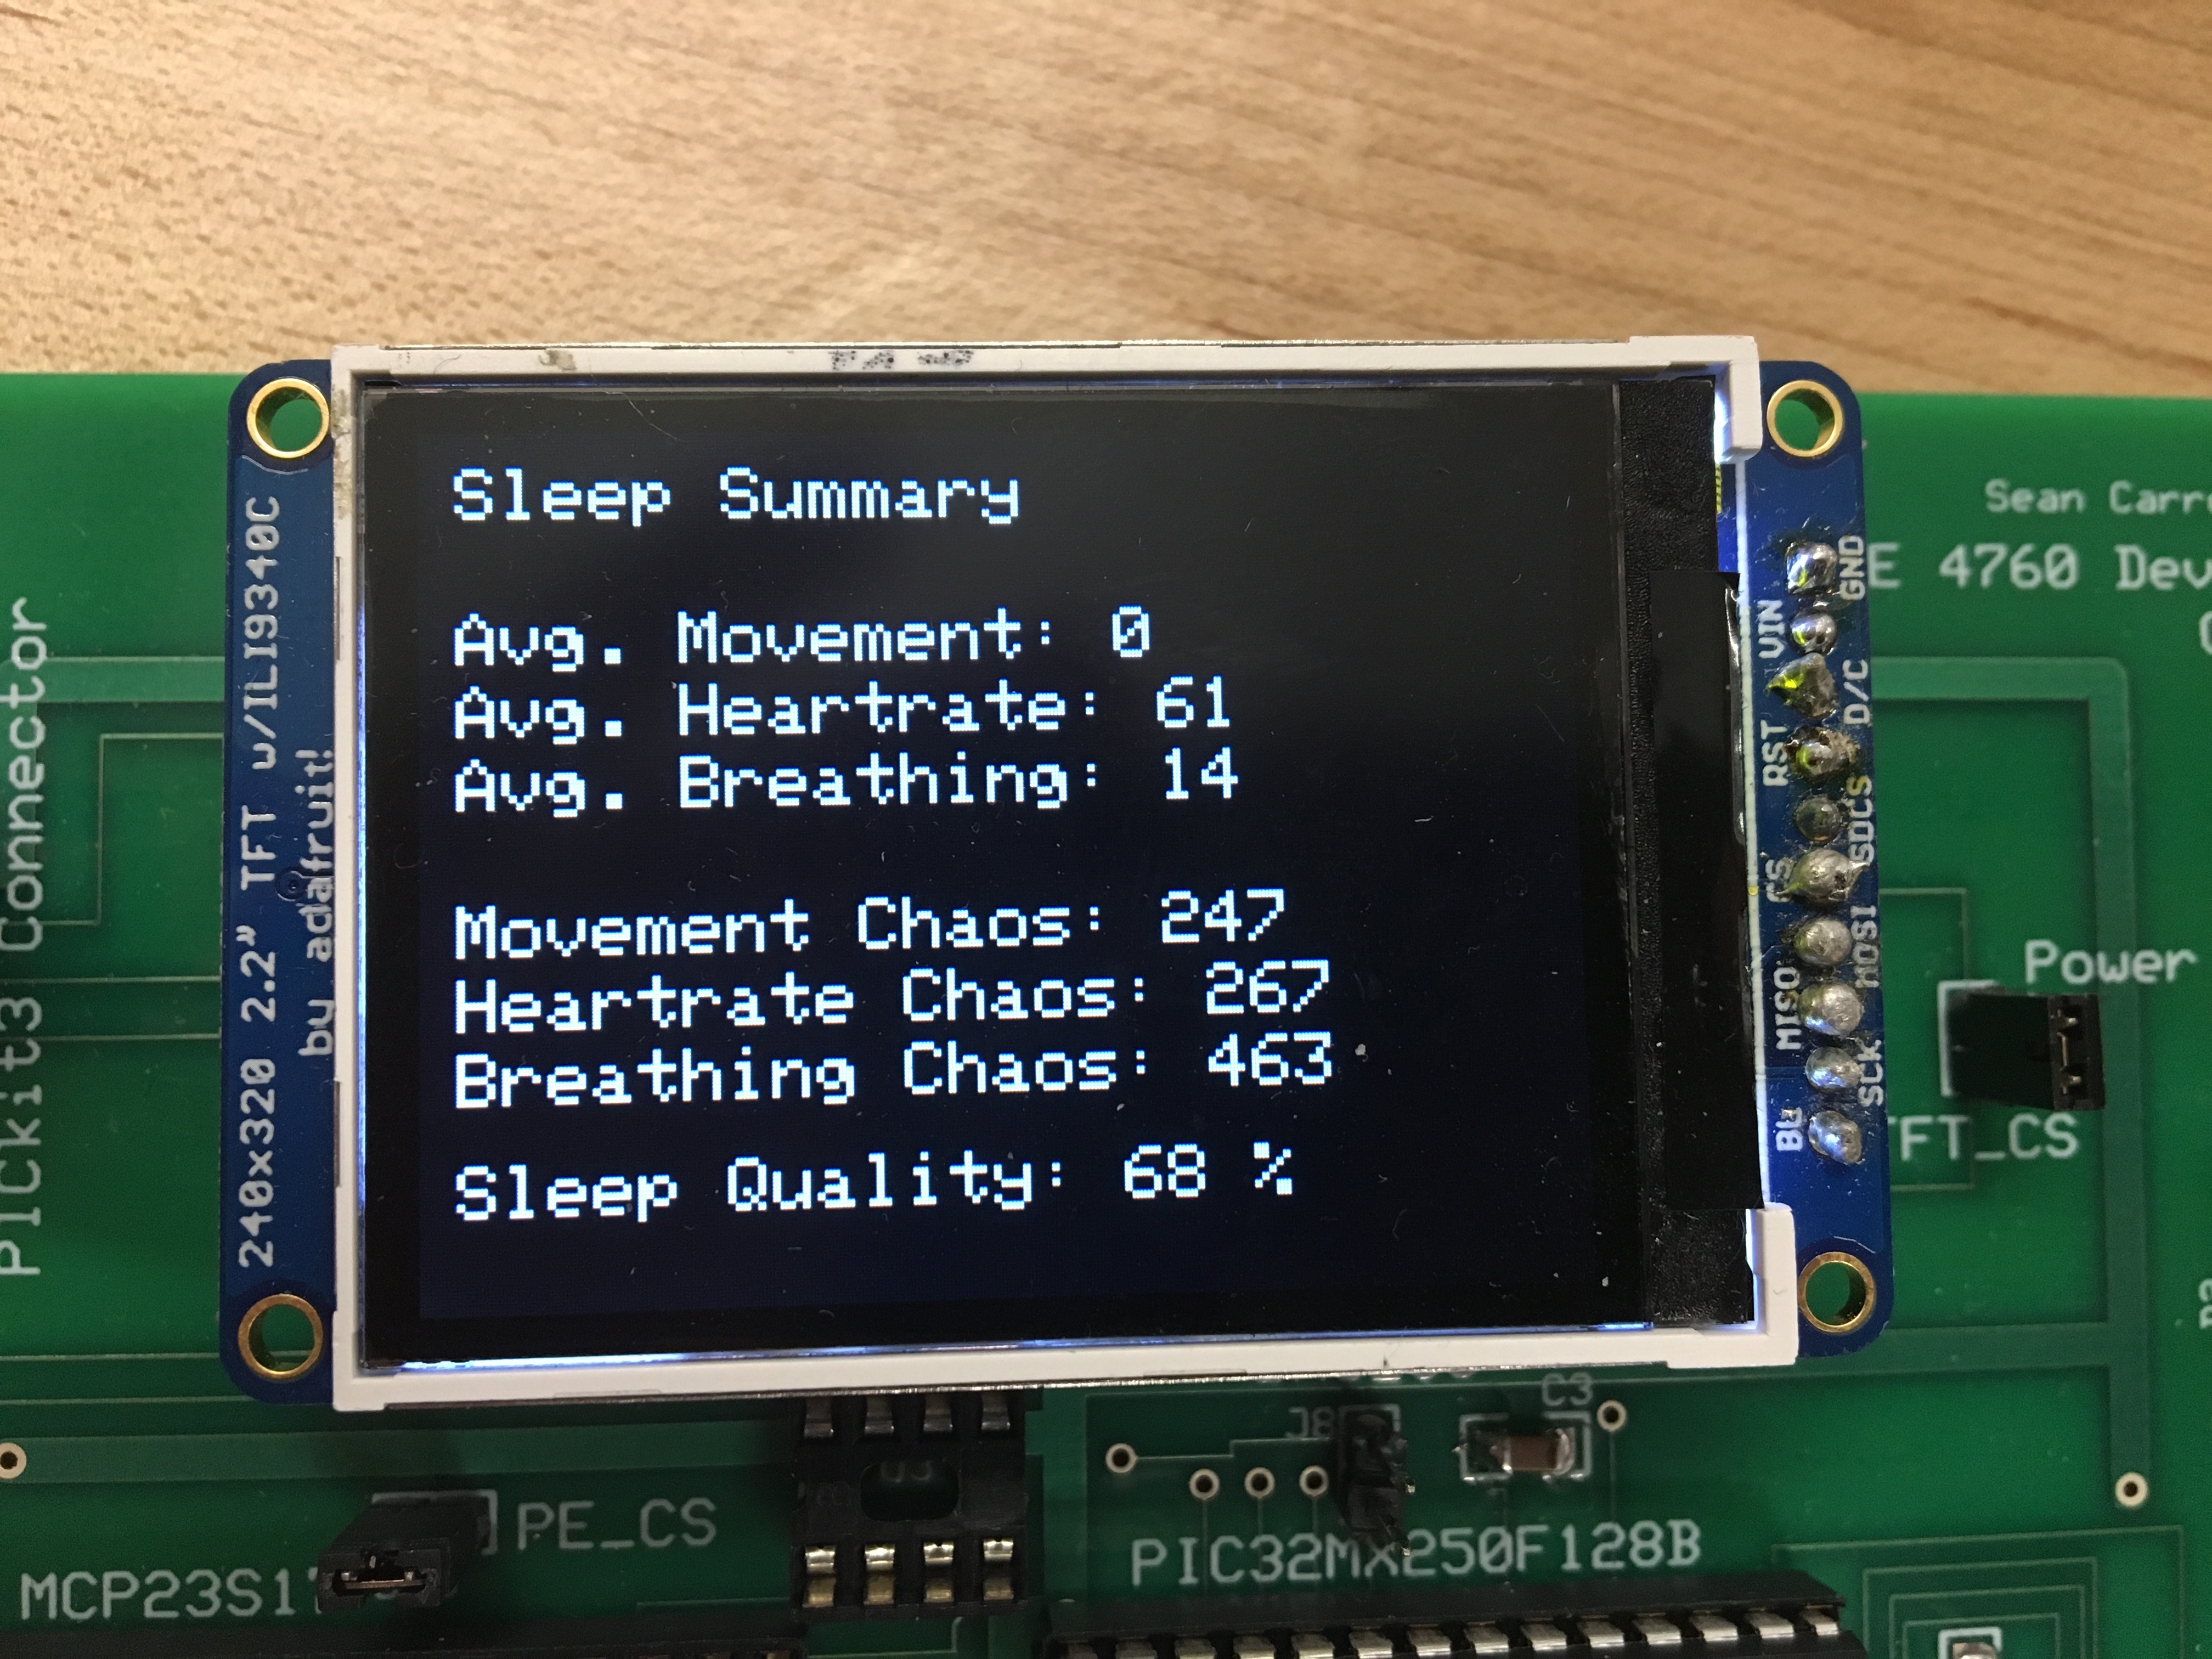
The output of our sleep analyzer includes the following: general level of movement, average heartrate, average change in heartrate, average breathing rate, and average change in breathing rate. The user can also see graphs of the three measured metrics, allowing them to see these patterns throughout their sleep. Below is the output summary for a single nap, starting with a summary page, and the three graphs, showing heartrate, breathing rate, and movement throughout the night.
Below we see the summary page that the meter has produced for this sleep. Average movement is 0, since the user spent most of the time motionless, as is expetected. The average heartrate is 61 beats per minute, which is quite healthy, and the average breathing rate is 14 breathes per minute. The next three metrics, called "chaos" metrics, denote the irregularity in each of the three metrics. The more cyclic and smooth a reading is over time, the smaller the chaos rating. Larger chaos ratings indicate a less restful sleep, as good restful sleep is generally characterized by smooth transitions in heart rate, breathing rate and relatively low amounts of movement. There is a decent amount of movement, an acceptably smooth heartrate, and a rather noisy looking breathing rate, which contributes to a relatively good sleep score of 68%, shown at the bottom of the screen.
Conclusions
Expectation versus Reality
Overall, our design met many of our initial expectations, even though our design pivoted slightly midway through the design process. We initially wanted to create a wrist mounted device, with a form factor similar to a watch, however that was contingent on us being able to measure a person's pulse through their wrist. This idea did not work out, and although we tried various techniques to measure heartbeat through the wrist, in the end we couldn't bring it to a reliable enough state to be useful for our project. The finished product, a glove that houses a circuit board on the top side of the palm is a second-best option, but one that we are quite happy with. The base station interface lived up to our initial expectations, however we would have liked to have spent more time tuning the sleep quality algorithm, but in its present state we believe if provides a good baseline of sleep quality.
Ethical Considerations
We strived to, and have, adhered to all 10 ethical tenets listed under the IEEE Code of Ethics.
We have tried to mitigate all hazards that this product could cause an individual. We have taken measures to ensure the user's safety while using the product, but it is currently not in a state where it can be used without supervision. The breathing sensor harness respresents a potential choking hazard, and the electronics on the glove are not perfectly sealed. In order for this to be a viable product, we would need to take many more measures to ensure the safety of our users. For our purposes however, close supervision during all test naps was essential.
We have been careful to provide proper references to all material that we used during testing, and code included in the final design that was not entirely written or inspired by ourselves. These references can be found in the appendix of this report.
We have an engineered a product that is suitable for nearly all users, using a "one size fits all" glove along with a breathing strap that can be adjusted to fit just about anyone. The abliity for this product to be used by a wide range of people has been an important factor in our design, and we have taken many steps to ensure that the product is as universal as possible and does not cater to any specific gender, race, sexual identity, etc.
We do not claim that the sleep quality metrics generated by this product are by any means absolute, the actual quality of sleep a user may experience can vary based on many personal factors. We claim that this product provides a good baseline for begninning to understand the factors that may influence sleep in both positive and negative ways, and giving our users access to data that they might otherwise be unable to obtain.
Legal and Intellectual Property Considerations
In our project, we utilized a module containing the nRF24L01 2.4 GHz wireless transceiver IC. This device operates in the 2.4 GHz range, in the band allocated for non-licensed use in the United States. Our device is compliant with a Class B transciever according to Part 15 of Title 47 of the FCC rules (47 CFR 15) which states that the device may not cause harmful interference, and the device must accept any intereference received, including intereference that may cause undesired operation. Class B also defines a maximum output power of 4 dBm, which equates to about 2.5mW, well below the 2 W maximum defined by the standards for a Class B transmitter.
Other legal considerations should not pose any issues to our design. We were careful to properly cite and refer to all external code used, making sure to use code under the license that accompanied it. We purchased all of our parts ourselves and did not sample any parts. We did not sign any non-disclosure agreements throughout the duration of this design process. We do not plan to market this as a product, but if we were, we would need to check for the currently patented sleep quality measurement algorithms that have been patented and make sure that we do not infringe on any of those patents.
Appendix
The group approves this report for inclusion on the course website. The group approves the video for inclusion on the course youtube channel.
Code
The commented code for our project can be found here .
Parts List and Budget
Part
Vendor
Part #
Unit Cost
Quantity
Sum Cost
nRF24L01+ Module
Amazon
nRF24L01+
1.2
2
2.4
LIS331 Accelerometer
Sparkfun
SEN-10345
9.95
1
9.95
Elegoo Nano Board
Amazon
Elegoo Nano
3.95
2
7.9
Conductive Stretch Cord
Sparkfun
PID: 519
9.95
1
9.95
Velcrow Straps
Amazon
B06WVCGC37
0.40
2
0.80
Cotton Gloves
Amazon
B06XCM84HB
0.33
1
0.33
Microstick II
Bruce Land
-
1
1
1
Big Board
Bruce Land
-
10
1
10
White Board
Bruce Land
-
6
1
6
PIC32MX250F128B
Bruce Land
-
5
1
5
TFT LCD
Bruce Land
-
10
1
10
Jumpers
Bruce Land
-
0.10
20
2
SIP Header Pins
Bruce Land
-
0.05
20
1
SOIC Carrier
Bruce Land
-
1
1
1
Total Cost
-
-
-
-
$67.33
Task Distribution
While the vast majority of the project was a combined effort, we broke up some of the work in the following ways:
Nick
Wrote software overview, conclusion, and high level design sections of the report
Wrote code to facilitate wireless communication
Wrote user interface and sleep analysis code on PIC
Bought various sensors
Tried Debugging PIC NRF library and SD
Julia
Wrote the heartbeat and breathing measuring code
Wrote introduction, hardware overview, and results section of the report
Created schematics both to base hardware off of and to use in the final report
We are extremely grateful to Bruce Land, Shaan Shetty, and the entire course staff for helping us through various problems throughout our design. The knowledge and intuition that they were able to share with us saved us a lot of time debugging and allowing us to quickly realizing our ideas. We are especially grateful to Bruce for showing us various heart rate monitoring circuits from his other classes, and experimenting different types of measurements alongside us.