Introduction top
The "bars" mode of our visualizer, moving to music in real time.
We designed an audio visualizer on an 64x64 LED matrix. Our objective was to create a system that reacts to an input music source in real time. The display has multiple different animation modes that the user can choose: bars, ball, and particle. These different scenes create a pleasant listening experience for the user, as they have some sort of graphical display to accompany their music. Our product can be used in a casual music listening session, as a showpiece in a party, and many situations in between. The system uses four 32x32 LED matrices and an Altera DE2-115 FPGA. The FPGA acts as a driver for the LED grids.
This project was completed over a five-week period for the ECE 5760: Advanced Microcontroller Design class under Professor Bruce Land.
High Level Design top
Overview
Our project runs off of an Altera DE2-115 FPGA, which handles all the controls and processing of data for the 64x64 LED Matrix as well as the beat detection and audio output. The heart of the beat detection comes from an onboard FFT. All of these components come together to create the LED Matrix Visualizer we have designed.
The LED Matrix Visualizer contains 3 modes: bars, single ball, and particle visualizer. The bar visualizer responds to the different frequency sub-bands of the audio while the latter two visualizers respond to the more general spectral energy changes in the audio input.
Motivation and Rationale
The idea for this project arose from our love for music. Sam had used a single 32x32 LED matrix for his ECE 4760 final project in Fall 2015. Naturally, the idea of building off of his work in the previous semester seemed like a good starting point, and the idea of creating an audio visualizer interested all of us. Bigger is better, so we wanted to expand the matrix from a 32x32 to a 64x64 grid. We believed that this project would provide us with both a greater depth of knowledge into using FPGAs, as well as allow us to explore something of interest to us.
Relation to Existing Works
This project is similar to the many LED Matrix display projects. There are lots of creative LED Matrix projects of every kind, however, they are almost all done by hobbyists who either do not actively share any code or are completely opensource. Everything we have done, excluding the resources referred to below, has been our own invention, inspired by our own interests and our peers' ideas.
Hardware and Software Trade-offs
Our project relies heavily on hardware. All of the code was written in Verilog. The FFT used for beat detection was implemented completely in hardware on the FPGA as well as all the control logic for the LED Matrix. We used python scripts to generate images for testing, and color maps for our different modes.
High Level Block Diagram
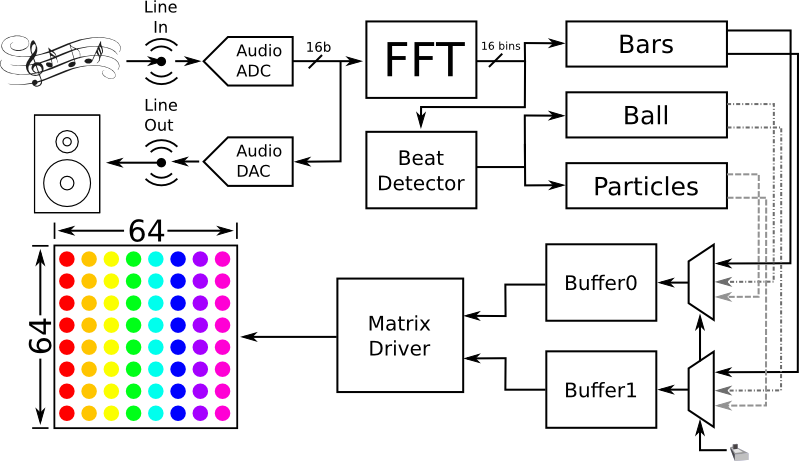
The block diagram below shows how the various components of our project interact with each other on the highest level. Our system starts with a musical input from the 3.5mm line-in input from the FPGA. This analog input is fed through an ADC to digitize the signal at a sampling rate of 48kHz. This signal is fed back through a DAC to the line-out port into speakers in order to play the audio. After the ADC, the audio signal is separated into its frequency components through our FFT module. These frequency components are used in a beat detection algorithm to detect large changes in signal energy, which correspond to beats in the song. The bars mode of the visualizer uses the frequency components directly, while the ball and the particle mode only use the beat of the song. Each of these 3 modules uses their inputs to calculate the coordinates and corresponding colors of each LED in the matrix. The outputs of the modules are muxed and written to two buffers (since the matrix writes to two LEDs simultaneously). From here, another module reads the contents of the buffer, and drives the LED matrix via the GPIO pins on the FPGA.
User Interface
The user interface is very minimal. The user needs to plug in an audio source into the line-in port of the FPGA and press play. Assuming everything is plugged in and turned on, the LED matrix should display visualizations. To change visualizations, the user needs to toggle some of the switches on the FPGA to change animations.
Hardware top
Hardware Overview
The hardware for this project included several components. The most notable component is the 4 Adafruit 32x32 RGB LED matrix displays connected with brackets to make the larger 64x64 display. Because the 4 LED displays consumed a large amount of power, an external 5V 30A power supply was used to power the LED Matrix Visuaizer. The system was controlled completely using Altera's DE2-115 FPGA. Music was read into the FPGA through its Line In port and internal ADC from which the audio was processed and output from the Line Out Port. While a VGA was used for initial testing of the visualizer, the final output was wired to the LED Matrix via the FPGA's 40-pin GPIO connection.
RGB Matrix Display
The RGB LED Matrix has a five part wire interface:
- 6 wire channel for writing two RGB LED values at a time - you can only write on or off for each of the red, green, blue values at each pixel
- 4 wire row selection - only two rows are on at a time these bits select which rows, the binary value 0 would turn on 0 and 16, 1 would be 1 and 17, etc.
- A clock signal - indicates that the color values should be latched for the next pixel
- A latch signal - indicates that we are done writing the selected row and the values should be latched and displayed
- A output enable signal - indicates that the currently selected row should be on
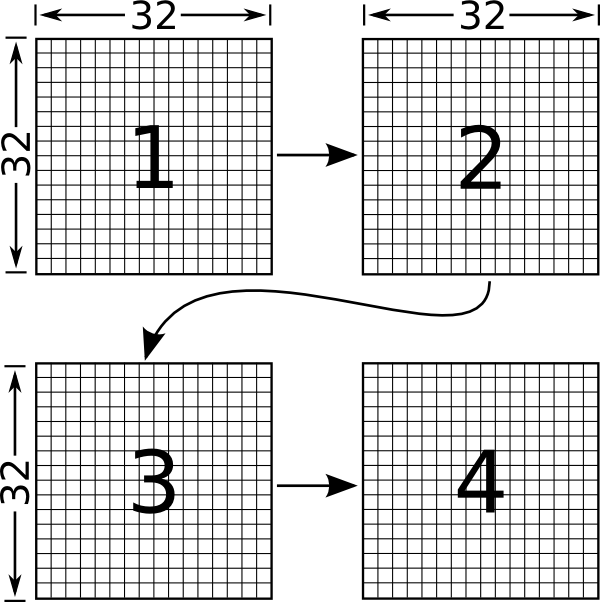
These pins are all connected to the FPGA's GPIO pins via a 16 pin (2x8) ribbon cable. In order to control all 4 LED matrix panels, the panels are daisy chained in the orientation shown below. Therefore, when control bits are sent to the display the first bit enters display 1 and then will be shifted to display 4.
Filter Bank
Initially, we designed a filter bank to pick out the different frequency bands in our audio input because we thought it would be simpler to implement than an FFT. This was used to serve as a backup in case we did not get the FFT working. We used code written by Tim Schofield and Adrian Wong in thier ECE 5760 Real Time Spectrogram final project as a basis to set up the filter bank. We modified the sampling rate and filter coefficients to fit our specific needs. We also noticed that their filter coefficients broke the necessary condition of being less than or equal to 1 and so we modified the code accordingly.
We used the switches on the FPGA to output the different frequency bands that were specified on the Line Out so that we could test out filter bank and ensure each filter was picking out the appropriate frequencies from the audio.
MegaWizard FFT
We used Quartus's MegaWizard in order to generate a 1024-point radix-4 FFT. The MegaWizard module also provided Matlab code for use in testing and understanding how to use the generated module. We modified the testbench generated by MegaWizard and tested the FFT on ModelSim. In order to generate a sine wave to input into our FFT module, we used the spring mass system from Lab 2 with symmetric initial conditions and no damping (to provide an ideal sine wave input)
OpenCore cFFT
We also tried using OpenCore's 1024-point radix-4 cFFT to implement our FFT module. We used the backend FIFO from Wancheng Zhou, Lu Yin and Joseph Lakeman's FFT Color Modulation of Mandelbrot Set to help buffer the data that was input into our cFFT.
Main Modules
The implementation of our LED Matrix Visualizer consisted of several modules that worked together to achieve the final product. Each module is described below:
fft_module.v
This module uses a backend FIFO to accumulate 1024 audio samples to be input into the FFT module. The output of the FFT is then broken up into 16 different bins across the frequency range of interest (0-15kHz). Originally, each of the 16 bins consisted of an average of 32 points from the FFT output; however, it was found that just taking one point around the frequency range of interest for each bin was sufficient. The amplitude for each frequency bin is averaged with the current and last two previous values in order to provide smoother transitions across each frame when displayed. The amplitude of each bin is representative of the amount of energy in the respective frequency range
thresholding.v
This module takes the output of the FFT module and averages the amplitudes with previous values to make a smoother transition when switching between frames on the visualizer.
audio_fft.v
This module displays the fft_module output onto the VGA. A set of bars represent each frequency bin and as the energy in a specific bin increases in the audio input, the bars elongate. The color of the bars also change according to how much energy is present.
coord_calc.v
This module is used to calculate the colors for each coordinate on the VGA monitor. It places the bars on the center of the screen and is used to draw the bars according to the FFT output, creating a simple visualizer for audio input
LEDMatrix.v
The LEDMatrix module is used to interface with the LEDMatrix display hardware through the GPIO pins. It exposes an interface to connect to two RAM buffers and then write out to the GPIO pins. It additionally exposes a buffer selection input and an output indicating the currently displayed buffer. The clock input dictates the operating frequency of the matrix control lines and therefore the frame rate of the display.
The module drives the matrix by bit pushing the red, green, and blue values to the display. The interface to control each individual LED matrix display panel is described in this other project by sgm82, LED Matrix Clock. For this project we use the same control scheme except implemented in a dedicated state machine which simply reads values from a buffer pushes the corresponding bits to the display. This implementation uses the same binary code modulation scheme to produce the various colors, however, due to the increased speed of the FPGA state machine we implemented 15-bit color (5 modulation stages instead of 4 for 12 bit color). We also use two separate pixel buffers so that we can update one buffer while displaying the other, then use the buffer selection input to indicate when switching is desired. This module then switches to displaying the other buffer before starting to display the next frame (but it continues to finish drawing the current frame). This helps make animations smoother and reduce tearing effects on the display.
Additionally, since we are controlling 4 daisy chained LED Matrices we had to account for some indexing correction in order to correctly shift all 128 control bits through the chain so that they display the correct orientation. Currently, if the order of the display
LEDMatrixTop.v
This module is the top level of our design. It simply integrates all the other modules mentioned in this section so that we can take the FFT of an audio input, use a beat detection algorithm, and visually display the audio on any of our three visualizer modes. It contains two tristate buffers for the LED display, and muxes to allow for switching between our different visualizers.
beat_detector.v
As its name implies, this module detects the beats present in the song. Its inputs are the frequency bins from the FFT unit, and it outputs a 1-bit value if it detects the presence of a beat. The beat detector sums the input frequency bins to find the instantaneous energy of the song for that specific window of the FFT. It then averages this value for 43 windows of the FFT, effectively capturing the average energy of the song for about a second at a 48kHz sampling rate. We then continuously repeat this process, comparing the average energy of the current window to a scaled version of the previous window. If the energy of the current window is drastically different from the previous window, then we have a beat.
bar_visual.v
This module creates our bar visualizer. It breaks up the 64x64 LED Matrix into 16 bins where each bin corresponds to a specific frequency range output by the FFT and thresholding module. The leftmost bar corresponds to the lowest frequency (on the order of 10Hz) while the rightmost bar corresponds to the highest frequency (on the order of 10kHz). Each bar is set with an initial thickness along the middle of the screen and as the energy in its frequency range increases, grows vertically in both directions.
ball_visual.v
This module creates our single ball visualizer. The ball begins with some initial x and y velocity. As it hits the edges of the LED matrix it bounces off the walls. On the rising edge of the beat, a random amount of x and y velocity is added to the ball. Also upon beat detection, the ball gradually changes color.
balls_visual.v
This module creates our particle visualizer. Balls are input into the left of the screen at random y locations with random x velocity making their way across the screen. Upon the rising edge of a beat, all the balls currently on the screen move a fixed amount in the y direction. The first beat causes the balls to move up, the second beat causes the balls to move back to their normal y position, the third beat causes the balls to move down and the fourth beat causes the ball to return to normal again. Each successive progression of beats repeats this process.
Software top
Overview
The entire visualizer system is implemented in FPGA hardware modules. However, we created several scripts to generate various memory initialization files and mapping modules. These scripts simplify testing and the creation of some ROM units.
Python Scripts
hexfile.py
This file provides an class for generating an Intel Hex file for use in Quartus as a ROM memory initialization file. It is used by the other scripts to convert a Python dictionary of address and hex value pairs to the correct file format. The files generated by this class can be loaded into the project to specify what the matrix displays on startup.
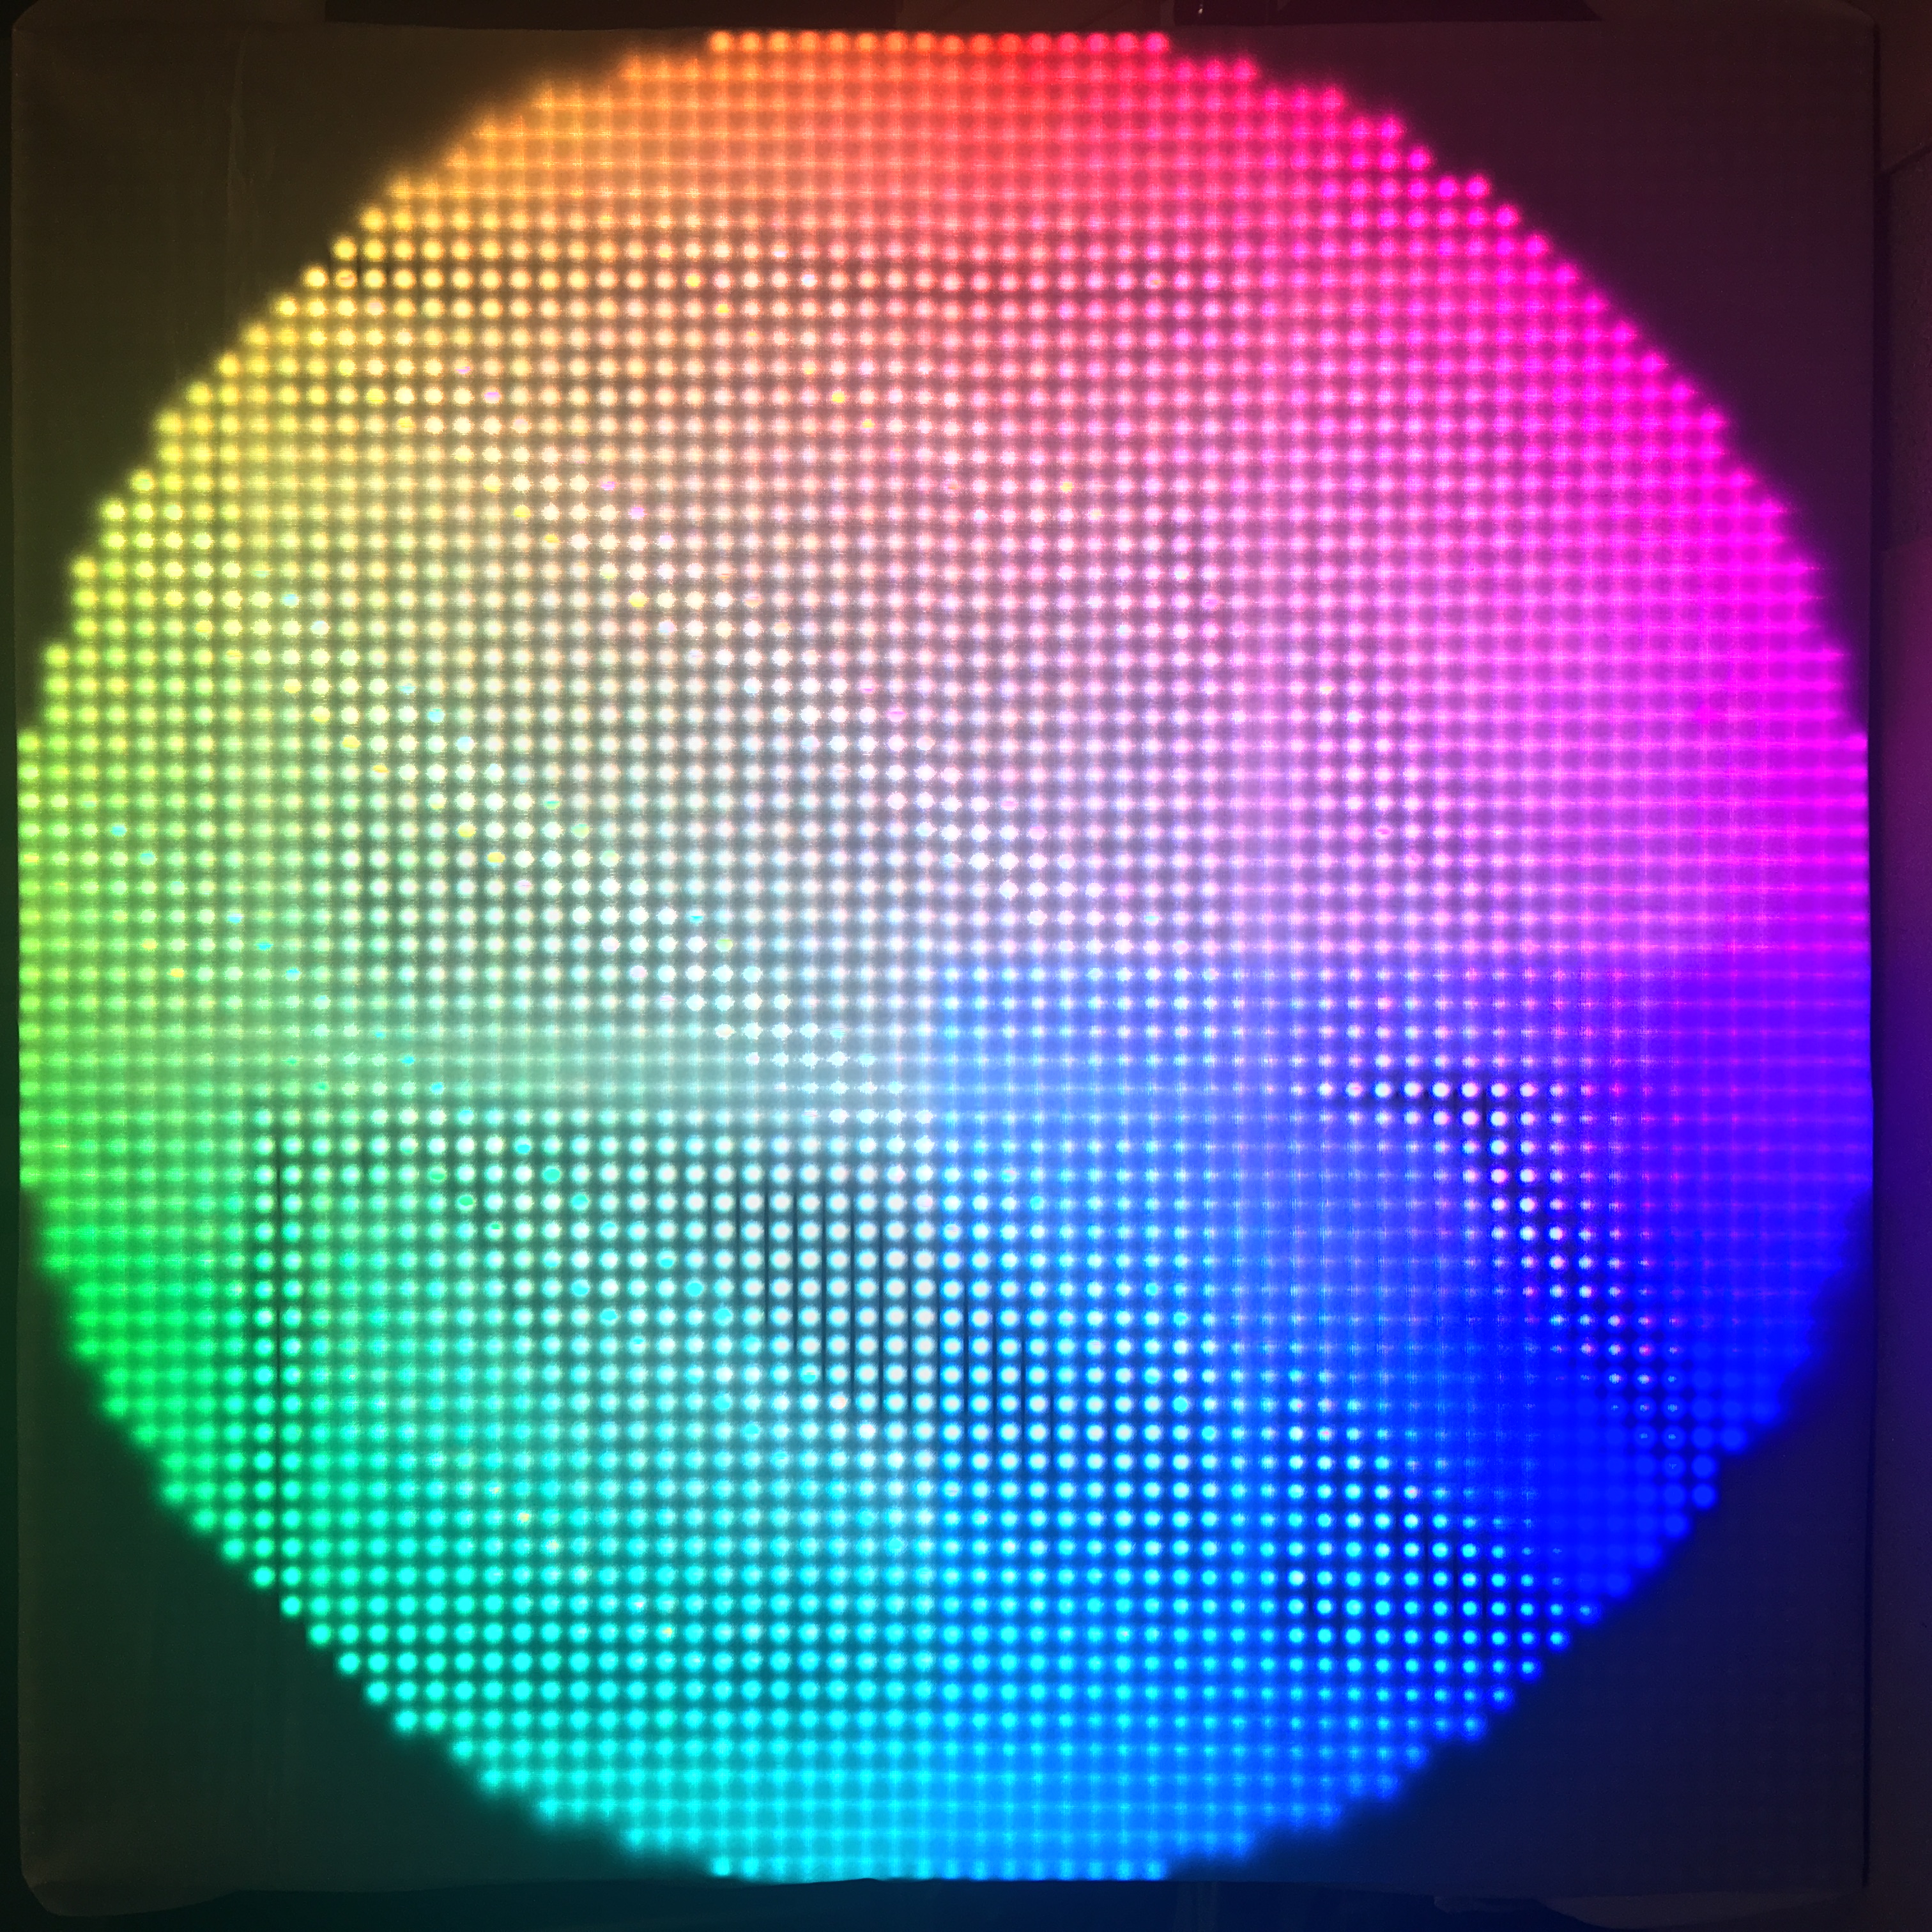
colorwheel.py
This file generates the colorwheel hex file by using HSV colors. This is a nice test of the matrix displays color spectrum.
imager.py
This takes a 64x64 pixel image file as input and converts the image into
gen_gamma_map.py
This generates the Verilog case statement for color mapping from 8 bit color to 5 bit color for each of red, green, and blue. It also shifts the color spectrum to attempt to produce more realistic colors by compensating for the LEDs varying intensity change as the brightness increases.
gen_ball_pixels.py
This generates the Verilog case statement mapping for the pixels to turn on for an 8x8 ball.
gen_hsv_map.py
This generates the Verilog case statement mapping 8 bit value to colors along the HSV hue spectrum.
Results top
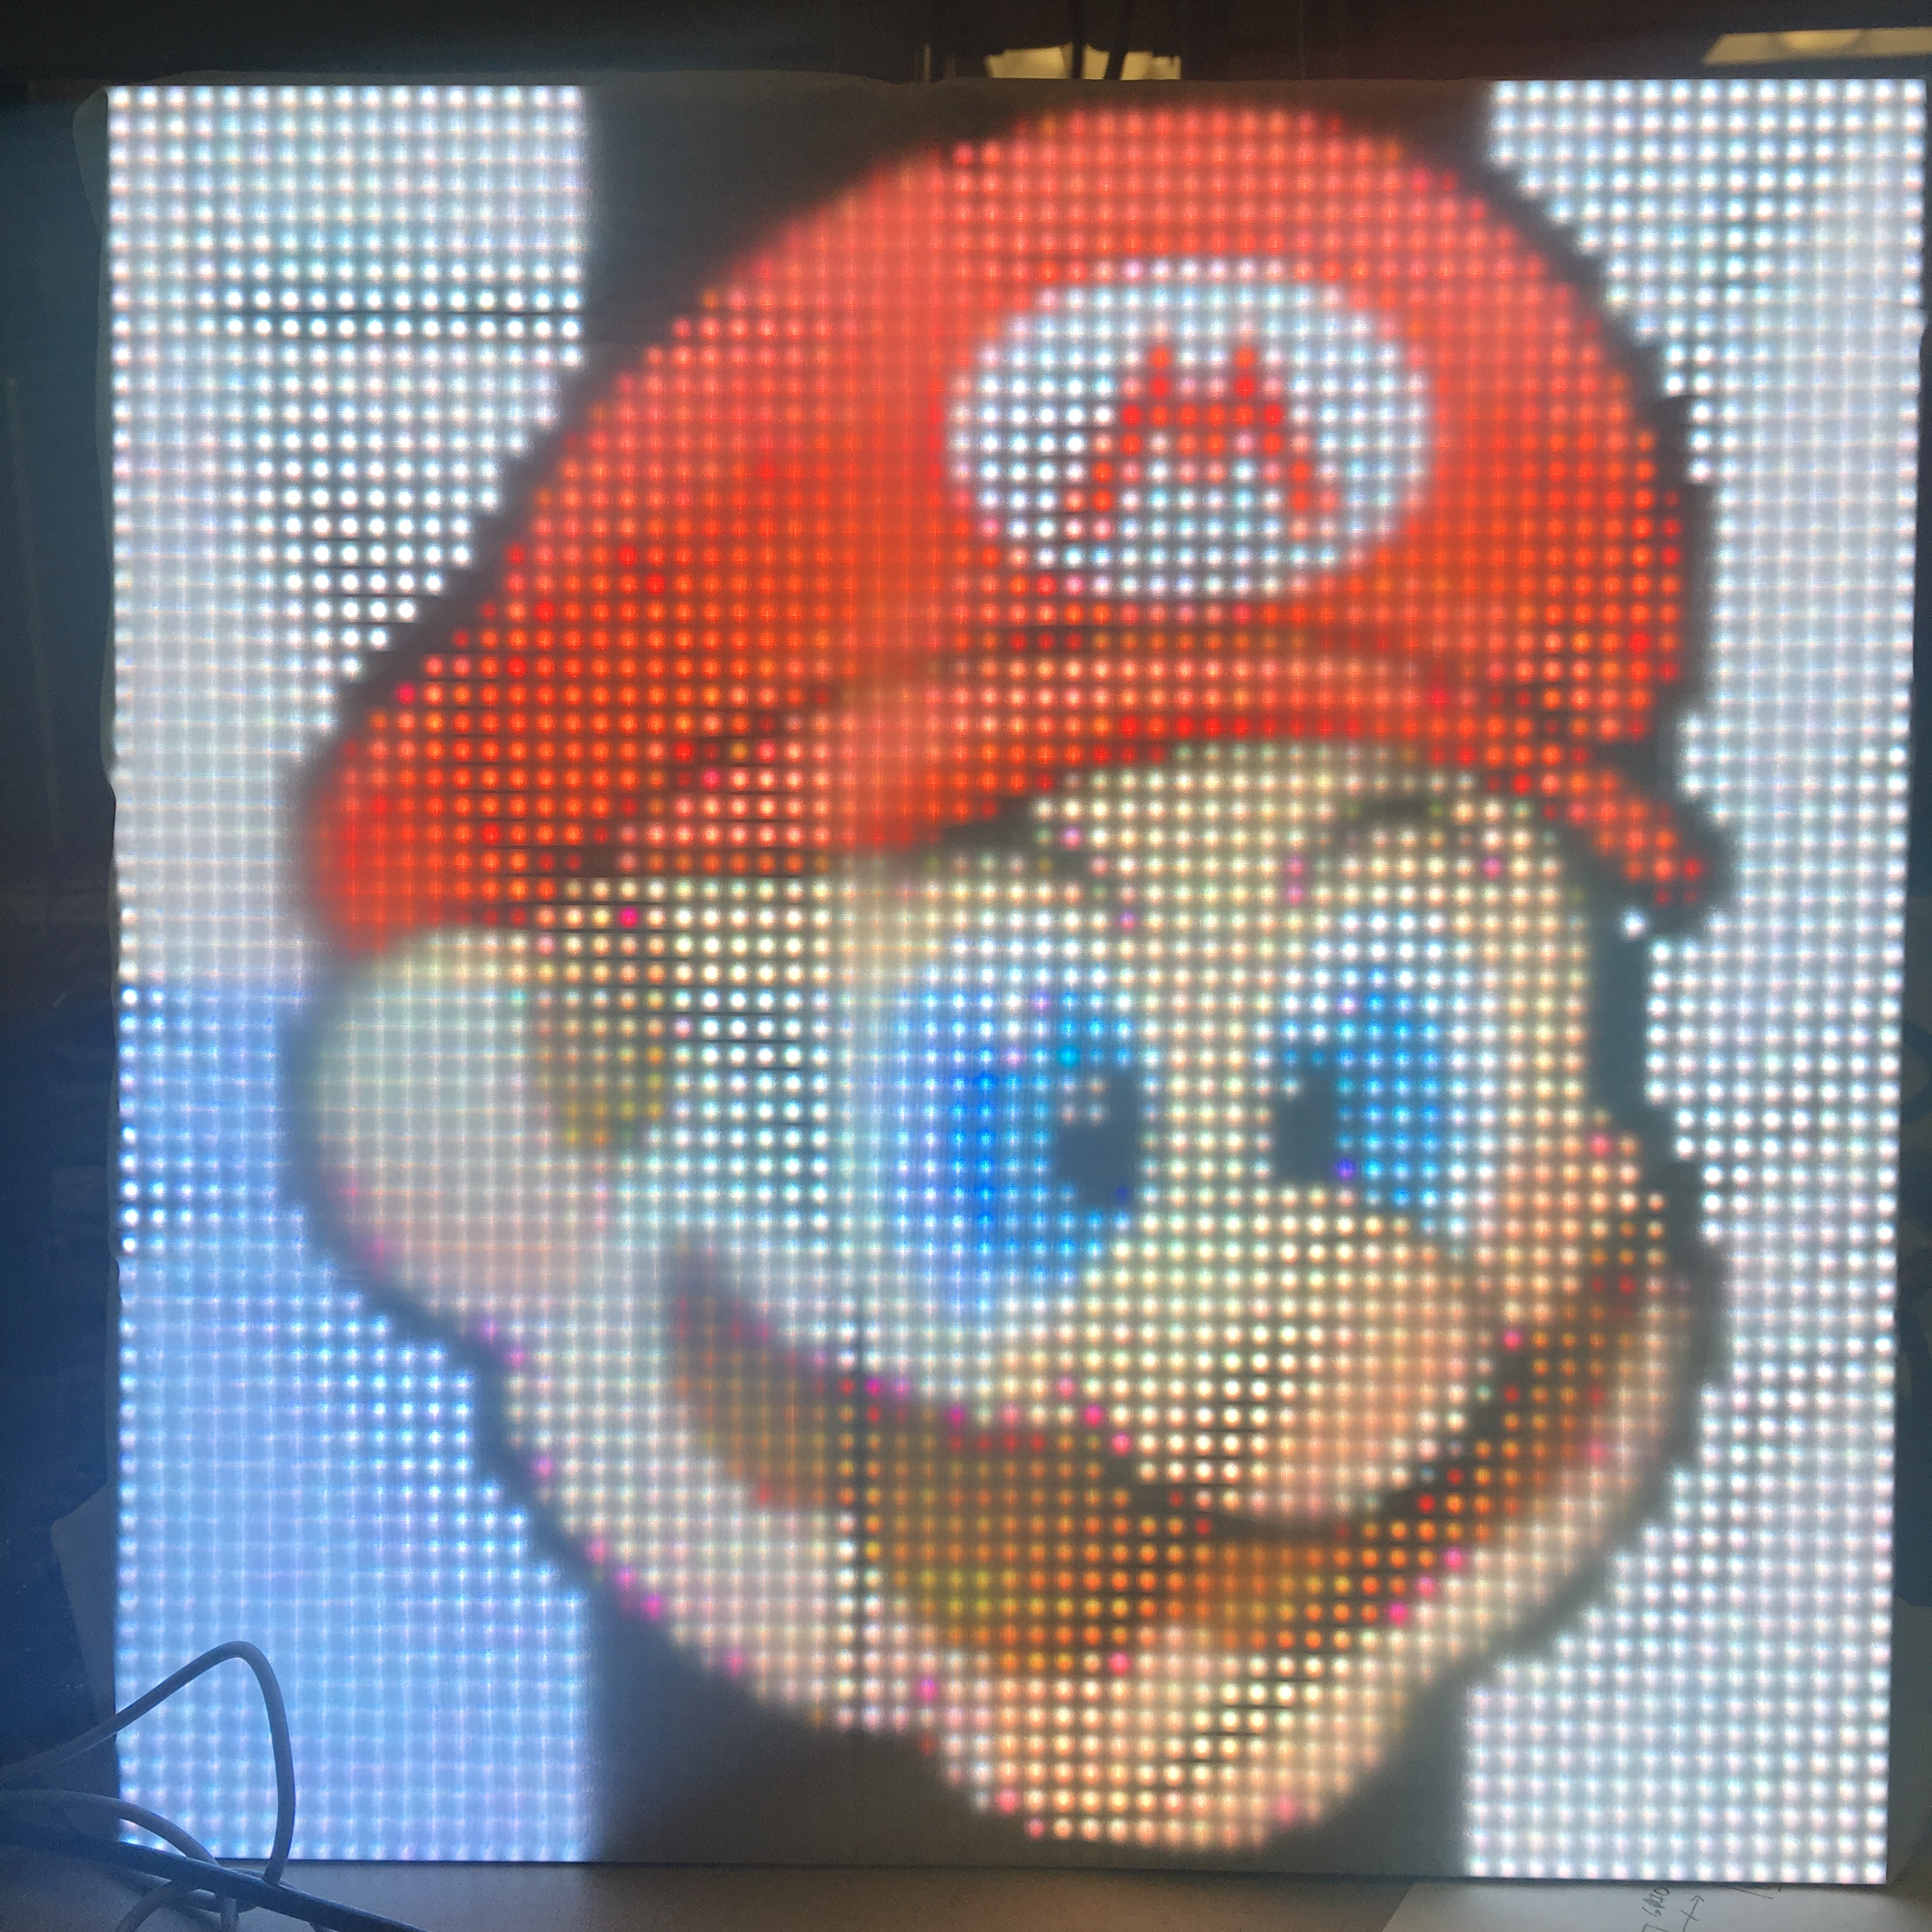
Left: The LED matrix showing a picture of everyone's favorite plumber: Mario. Right: The LED matrix displaying the Cornell University logo.
Matrix Display
The matrix display results were very good but could use some improvement. In our current setup, we run the matrix with a clock of 20Mhz. Since it has a 1/16 scan rate and each row takes 130+130*2^1+130*2^2+130*2^3+130*2^4 = 4030 cycles (due to the binary code modulation), we have a frame rate of 20000000/(4030*16) = 310 frames/second. We were able to run the matrix at a clock speed of up to 40 MHz (frame rate of 620), however, we started to see pixels wrap around the display. We are still what causes this anomaly. At 40 MHz, however, aside from the single artifact, the screen is very smooth with no noticeable flickering. We additionally found that running the display at 2MHz or below (roughly 31 frames/second), the display is noticeably flashing due to the scan rate.
As it is the display is visually excellent for all colors and animations. We did notice that the display had flickering pixels when the matrix power voltage was too high. While the specified voltage is 5 volts, we found that driving the matrix with a voltage of around 4.5 volts significantly reduced flickering pixels and increased the stability of the entire display.
Filter Bank
We successfully implemented a 32-filter filter bank where the switches on the FPGA were used to choose which filter bank to play through the speakers. When testing we noticed that our filters were too broadband to pick out specific frequencies of the song. For example, our low frequency filters that were supposed to pick out the bass in the song, seemed to include a decent amount of higher frequency content as well. We ran into some trouble finding realizable coefficients that would make our filters narrow enough to pick out the specific frequency ranges we desired. Thus we determined that using an FFT would be the best method for audio visualization.
MegaWizard FFT
We ran into some diffuclty when using the MegaWizard FFT. While we were able to successfully create a testbench using a sinewave input generated from our spring mass system from Lab2, the output from our FFT seemed to suffer from overflow issues. Because the MegaWizard FFT seemed to be significantly more complex than the OpenCore cFFT, we decided to use the module provided by OpenCore instead.
OpenCore cFFT
The OpenCore cFFT seemed to have the easiest interface to use and thus was implemented in our final product. We divided the output of the cFFT into 16 bins spanning across the frequency range of interest and displayed the bins on a VGA for testing. As more energy was present in a specific bin, that bin grew in length. Using a tone generator app on the iPhone, we swept from frequencies of 10 Hz to 20kHz to make sure the bins responded appropriately. Each bin was only responsive to a small sub-band of the frequency range and as the frequency increased, the responsive bins moved from left to right.
Bar Visualizer
The bar visualizer was adapted from the code for the VGA display. This mode seems to work fairly well with different bars responding to different parts of the audio. When the music is fairly empty with only vocals or a simple melody/beat, the visualizer follows the music very well. This visualizer mode can take 2 colors, with one setting consisting or warm colors and the other with cool colors. The color mode is set with a switch on the FPGA. We tried to use a logarithmic scale to determine the amplitude of each bar; however, due to a few bugs and time constraints the linear scale seemed to give the best results.
A video of the bar visualizer can be seen below:
Ball Visualizer
The single ball visualizer also performs fairly well. While sometimes the ball wraps around from one side of the LED matrix to the other when it hits the walls, for the most part it stays in the confines of the matrix. As the ball detects beats, it also slowly changes color across the 15-bit color wheel. We noticed that the beat detection, and thus ball visualizer, works better with hip hop and more sparse audio than with rock music and other audio with a high level of energy continuously playing. Additionally, increasing the velocity of the ball seems to provide a better visual display of beat changes.
A video of the ball visualizer can be seen below:
Particle Visualizer
As we increase the number of particles on the screen at once, this visualizer seems to provide a better user experience. As with the single ball visualizer, this mode performs best when the input audio was more sparse over time. The ball velocity along the y direction did a great job in visualizing large changes in the music. We added several color options for the particles controlled by switches on the FPGA.
A video of the particle visualizer can be seen below:
Conclusions top
Summary
Overall our project was very successful. We ended up being able to create 3 different visualizers and obtain 15-bit color control on each of the LEDs. The bar visualizer is the most stunning of the three modes, as it moved the most in response to stimulation. Changes in 16 frequency bands could be seen in the 16 bars on screen, so it was very satisfying to be able to pick out bass, snare, and hi-hat hits, as well as vocal melodies. The single ball and the particles moved to the beat for the most part, but these two modes were more finicky. This is mainly due to our beat detection algorithm. Improvements to our implementation would make the ball movements more discernible. Ideally we would have implemented a few more animation modes, but we ran out of time. However, we are still very happy with our results. The bar visualizer responds very well to each frequency bin, the particle visualizer has the added functionality of being able to cycle through multiple color modes, and the single ball visualizer is a calm change from the other two busy modes. We hope to continue to work on this project in the future, adding other modes such as time domain waveform displays, color wheel modulation, and other more intricate visualizers.
Applicable Standards
Our project did not have any standards that applied to it.
Intellectual Property Considerations
We utilized the cFFT module from OpenCores. As all of their IPs are open source, we were free to use their software for our needs, provided proper references. Additionally, we based our FFT implementation off of the FFT Color Modulation of Mandelbrot Set project from a previous ECE 5760 class. However, we asked Wancheng Zhou if we could use his code as reference, and he happily shared.
Although we did not use the bandpass filter bank in our final implementation, we still list it here for completeness. The original 18-bit filters were designed by Bruce Land, including the hardware implementation and Matlab code which generates the coefficients. We also used the filter bank generation code from the Real Time Spectrogram project. However, we modified the coefficients to fit our needs.
Furthermore, we employed Altera's Megawizard utility for several of their IPs.
Ethical Considerations
Throughout the entire period in which our project was performed, future and prior, all members of our team strictly followed the IEEE Code of Ethics. All decisions within the group were made with the safety of all members and welfare of the public put foremost. No conflicts of interest were encountered during our project. All data and measurements stated on this page are truthful to the best of our knowledge. Even though no bribes presented themselves, no bribes were accepted, nor would they would have they been. All efforts in this project were intended to improve our group's understanding of technology, its appropriate application, and potential consequences. Before any movements were taken on the part of the group, thorough research and comprehension was performed to ensure that the project stood within any pertinent limitations. Technical criticism was welcomed and sought by all members in an effort to acknowledge, learn from, and correct errors. Additionally, all members openly gave technical criticism to those who sought it. All outside contributions to this project were properly accredited in the appropriate manner. No person was ever discriminated against for any reason based upon race, religion, gender, disability, age, national origin, sexual orientation, gender identity, or gender expression. No action from any of our members injured anyone, their property, reputation, or employment by false or malicious action. Lastly, all members assisted colleagues and co-workers in a professional manner to provide helpful development and to support them in following the aforementioned IEEE Code of Ethics. Every possible action was taken to make this project safe, enjoyable, and rewarding for every entity involved.
Legal Considerations
To our knowledge, our device does not violate any legal regulations. Use of lab equipment was authorized with prior permission from the lab staff.
Appendices top
A. Source Code
We are in the process of verifying the IP considerations of releasing our source code. Once we have released our source code it will be available at our GitHub Repository
B. Division of Labor
- Sam
- LED matrix hardware design
- LED matrix hardware assembly
- LED matrix color testing and gamma correction scripts
- LED matrix mapping generation python scripts
- LED matrix image conversion python scripts
- LED matrix control system modules
- LED matrix reactive visualizer modules
- Sahil
- Filter bank testing
- Design of MegaWizard FFT testbench
- MegaWizard and OpenCore FFT testing
- Implementation of frequency bins from FFT
- VGA visualizer design and testing
- Implementation of beat detection algorithm
- Integration of fft/beat dection with LED matrix vizualizer modules
- Mashrur
- Audio back end
- Filter bank design and testing
- MegaWizard and OpenCore FFT testing
- VGA visualizer design and testing
- Frequency binning of FFT
- Implementation of beat detection algorithm
- Integration of fft/beat dection with LED matrix vizualizer modules
- All
- Created this webpage
References top
The following lists (to the best of our ability) all the websites and resources that provided us with the information that made this project possible.
Datasheets
Acknowledgements top
First and foremost, we thank Professor Bruce Land for another amazing class at Cornell University.
We thank our lab TA, Shiva, for working so hard to make the class possible even while taking the class himself.