High Level Design
Design Rationale
The idea of our project stemmed from seeing one of the previous
ECE 4760 final projects, Musical Water Fountain. In their project
, they used Fast Walsh Transform to analyze audio signal
generated by a MP3 player (shown in table below).
| LED |
0 |
1 |
2 |
3 |
4 |
5 |
6 |
7 |
| Freq |
0-170 |
170-310 |
310-420 |
420-560 |
560-680 |
680-820 |
820-930 |
930-10000 |
Then they would turn on the LED that corresponded to the most
energetic frequency division in the input frequency spectrum.
This made us wonder if identifying speech is possibly by a method
similar to this.
In fact, with today's technology, speech recognition is fully
realizable and can even be fully synthesized. However, most of the
software that deals with speech recognition require extensive
computation and are very expensive. With the limited computation
power of mega644 and a $75 project budget, we wanted to make a
simple, smart voice recognition system that is capable of
recognizing simple vowels.
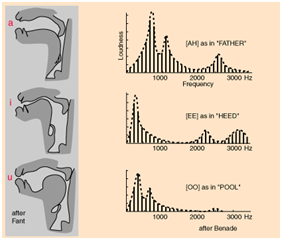
After careful research and several discussions with Bruce, we
found that vowels can be characterized by 3 distinct peaks in
their frequency spectrum. This means if we perform a transform
to input speech signal, the frequency spectrum profile will
contain characteristic peaks that correspond to the most
energetic frequency component. Then if we check to see if the 3
peaks in the input fall in the ranges we defined for a specific
vowel, we will be able to deduce is that vowel component was
present or not in the user's speech.
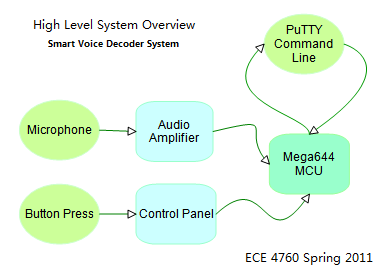
Logical Structure
The main structure of our decoder system centers on the mega644
MCU. Our program allows the MCU to coordinate commands being
placed by the user via PuTTY and the button panel while analyzing
the user's audio input in real time. On the lowest design level
(hardware), we have microphone and a button panel to convert
physical inputs by the user into analog and digital signals the
MCU can react to. On the highest level, PuTTY displays the
operation status of the MCU and informs the MCU of user commands
being placed at the command line. PuTTY also offers user the
freedom to test the accuracy of our recognition and simulates a
security system where the user must say a specific sequence of
vowels to see a secret message.
Mathematical Theory
Vocal Formats
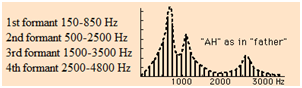
Basically, the first three formant frequencies (refer to
peaks in harmonic spectrum of a complex sound) can attribute to
the different appeal of vowel sounds.
Therefore, if we can pick out formant by intensities in
different frequency ranges, we can identify a vowel sound and
use sequence of vowel to generate an audio pass code specific
to that vowel.
Frequency Transform Algorithms
The biggest difference between our analysis
and musical intensity is that we need to adjust the frequency
range stated above to better tell apart the difference between
several peaks and combine all other information including
amplitude. We need to decide which frequency transform
algorithm is better to be used for a real-time audio
addressing in both accuracy and computation speed. In fixed
point DSP function in GCC, DCT, FFT & FWT are several common
used algorithms. In our case, we chose Fast Walsh Transform
over the rest simply because of its speed and its linear
proportionality to Fast Fourier Transform.
The Fast Walsh Transform converts the input waveform into
orthogonal square waves of different frequencies. Since we
are only working with voice ranges here, we set the sample
frequency to 7.8K which allows us to detect (ideally) up to
3.8kHz. We also knew that the lowest fundamental frequency
of human voice is about 80-125Hz. Thus, we chose a sample
size of 64 bit. This generates 32 frequency elements equally
spaced from 0Hz to 3.8kHz (not including the DC component).
The individual frequency division width is 3.8k/32=118.75Hz
which gives maximizes our frequency division usage (since we
could have useful information in every division instead of
say a division width of 50Hz, where the first division does
not provide useful information). Furthermore, this choice also
minimizes our computation time since the more samples we
have to compute, the more time it will take for the MCU to
process input audio data.
MATLAB Simulation Results
In this part, most research we did were based on common
vowel characters like 'A','E','I','O','U', which demonstrated
that the method we attempt to develop could achieve. Yet in
the real case, we found that the difference of these five
characters is not as obvious as simply comparison between
frequency sequency could distinguish.
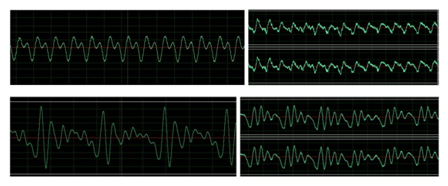
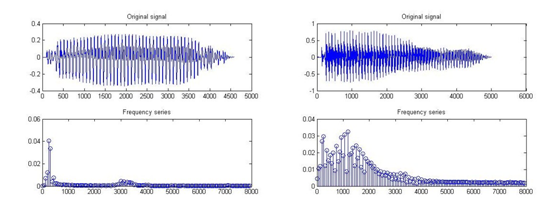
We first use Adobe Audition to observe initial input
waveform taken directly from Microphone and AT&T text2speech
as shown in the picture. Although the waveform corresponding
to the same vowel would result in a similar shape, there still
exists difference which we may find more straightforward in
frequency domain.
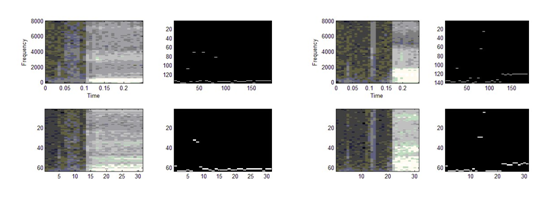
The first program in MATLAB is based on Prof. Land's code
that compares the FFT and FWT outputs as spectrograms, then
takes the maximum of each time sliced transform and compares
these spectrograms. Top row is FFT power spectrum, FWT sequency
spectrum is in the bottom. The maximum intensity coefficient
of each spectrogram time slice in FFT and FWT are almost in
the same shape. We'll take one spectrum as an example.
Another program directly implements FFT and show a frequency
series. In this figure we can clearly see the resonance peaks of
a vowel. This transform is 256 points. Also, notice that because
of noise interference, it would be hard to tell apart the second
peak for [EE] and this is not the only case.
Hardware/Software Tradeoffs
Due to the limited precision of our Fast Fourier Transform,
frequencies that differ by a value that is less than the width
of our frequency division are often not distinguished. When
dealing with boundary frequencies, this was a problem for us
since the peak frequency did not always reside in the same
frequency division. To improve upon this, we used multiple
divisions but we still had errors since we cannot consider
every possible boundary case. We improved upon this further
by boosting the gain of our op amp from x10 to x100. This
boast gave us a much better summary result and reduced our
error. However occasionally, we still have errors that stem
from the precision of our analysis tool.
Relations to IEEE Standards
The only standard applicable to our design is the RS232
serial communication protocol. We used a MAX233 level shifter
and a custom RS232 PCB designed by Bruce Land.
Relevant Copyrights Trademarks and Patents
The mathematical theories for frequency analysis of audio
signals were obtained from both discussions with Bruce Land
as well as R. Nave's
webpage from Georgia State University.